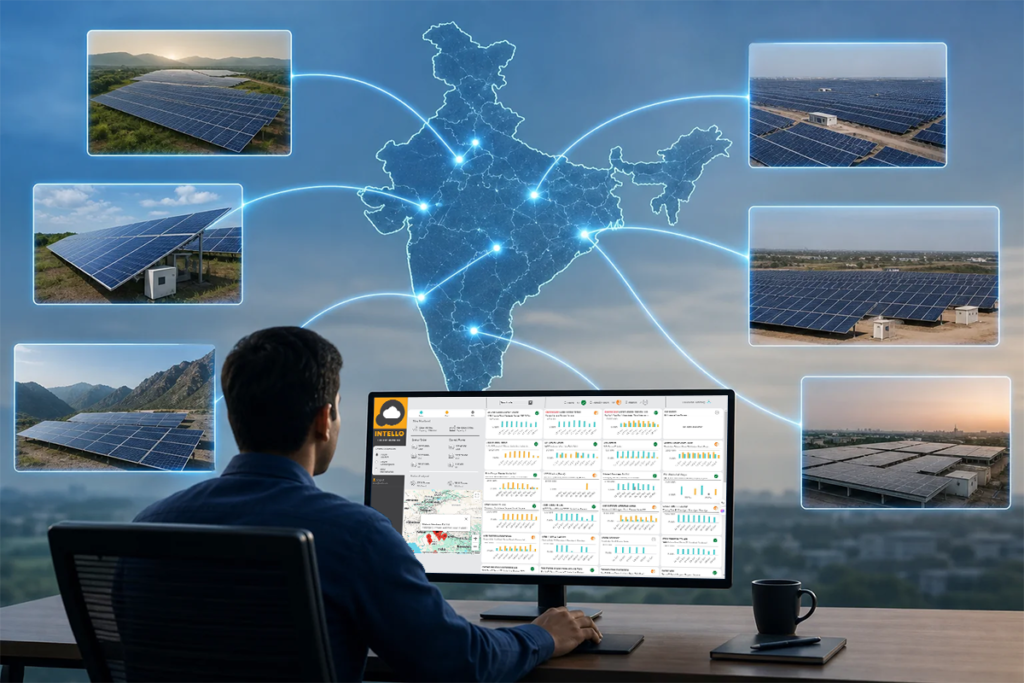
A solar bill not reduced after installation almost never means the panels are defective. In most cases the gap traces back to a measurement mismatch between your monitoring app and your utility bill, a net metering credit that hasn’t posted yet, an inverter fault nobody noticed, or a tariff hike unrelated to solar at all. Working through these checks in order usually finds the answer within an hour.
Key Takeaways
- App vs bill mismatch is the most common cause: your monitoring app shows total generation, but your utility only bills what crossed the meter, so the two numbers are never meant to match exactly.
- Inverter fault codes explain sudden drops: a string fault, ground fault, or overtemperature derating can quietly cut output for days before anyone checks the display.
- Net metering credits lag by a billing cycle: exported units often show up on the bill after your DISCOM’s next reading, not immediately.
- Tariff and fixed-charge hikes are not a solar problem: if your DISCOM raised per-unit rates or demand charges, the bill can rise even with a perfectly healthy system.
- Escalate to a professional if generation is below 80% of the expected range for your system size after ruling out billing and rate issues.
Quick Diagnostic Summary
| Check | What to look at | Tool needed | Red flag |
|---|---|---|---|
| App vs bill comparison | Total generation vs grid import/export kWh | Monitoring app + utility bill | Bill shows high import despite high app generation |
| Inverter logs | Daily kWh, fault codes, downtime gaps | Inverter display or portal | Zero-output hours during daylight |
| Net metering credits | Export kWh on bill vs inverter export log | Utility bill statement | Exported units missing or delayed beyond one cycle |
| Expected vs actual output | System size × irradiation vs logged generation | Monitoring dashboard | Actual output below 80% of expected range |
| Tariff structure | Per-unit rate, fixed charges, demand charges | Latest bill vs previous bill | Rate per unit increased between billing cycles |
| Physical site condition | Shading, soiling, visible string damage | Visual inspection | Dust film, new shadow, or bird droppings on panels |
1. Compare Your Monitoring App Data to Your Actual Utility Bill
Start here because it resolves the confusion fastest. Your monitoring app reports total system production, meaning every kilowatt-hour your panels made, whether you used it instantly at home or it went straight to the grid. Your utility bill only tracks what crossed the meter: what you pulled from the grid and, where applicable, what you exported. It has no visibility into power you consumed directly from your rooftop before it ever reached the meter, a point Solar United Neighbors explains in detail.
That’s why a strong generation day on the app can still show up as an ordinary or high-usage day on the bill. It isn’t an error, it’s two different measurement systems answering two different questions.
Pull both documents side by side. Note your app’s total kWh for the billing period, then find your bill’s “units consumed” and “units exported” lines. If the app number is healthy but the bill’s import figure is nearly what it was before you had solar, the issue usually lies in when you’re using power, not how much you’re generating. GreenLancer’s breakdown of common bill mismatches covers this same pattern for U.S. systems, and the same logic applies under Indian net metering.
2. Check the Inverter Logs for Fault Codes and Downtime
Open your inverter’s daily log, either on its front panel or through the manufacturer’s portal, and scan for gaps. A healthy system produces a smooth bell curve from sunrise to sunset. Flat zero readings during daylight hours, or a curve that cuts off early in the afternoon, point to a fault.
Look specifically for string fault, ground fault, or overtemperature derating codes. A string fault can silence one entire section of panels while the rest of the array reports normally, which drags down total output without necessarily tripping the whole system offline. If you’re unsure how to read a specific code, our solar inverter troubleshooting guide walks through the most common ones and what each means for your output.
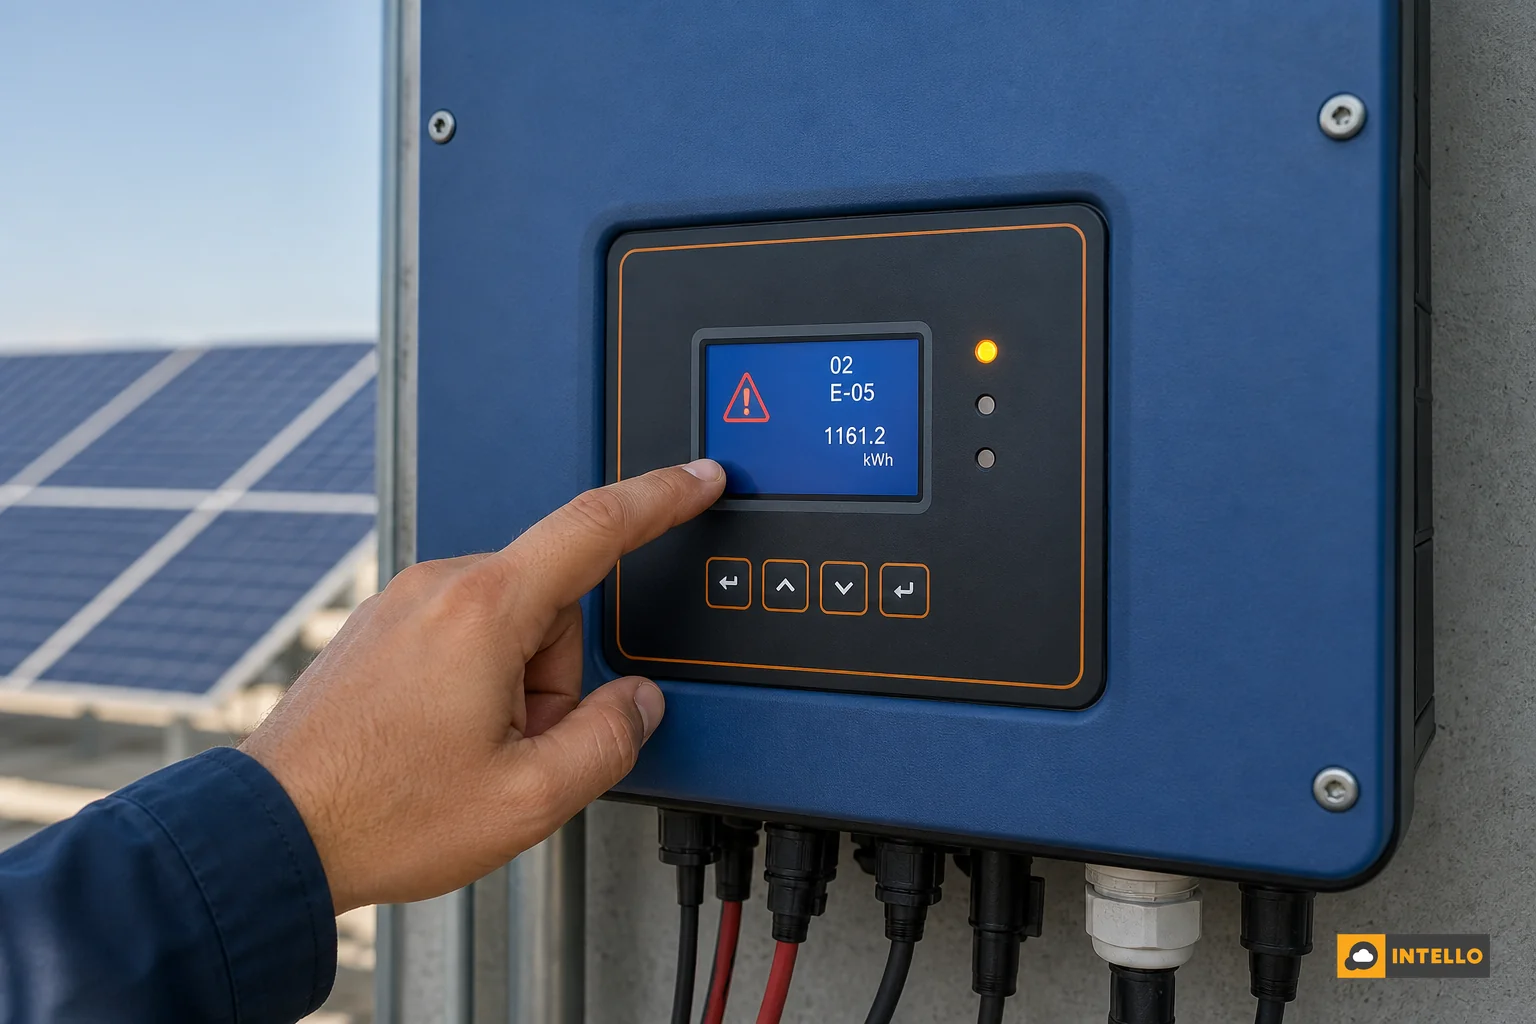
If your inverter has been derating due to heat, check where it’s mounted. Inverters installed in enclosed spaces without ventilation run hotter and cut output automatically to protect their electronics, a fault that never shows on a bill but quietly reduces generation every afternoon.
3. Verify Net Metering Credits Are Actually Being Applied
Net metering credits often lag behind actual export by a full billing cycle. If you exported surplus units in June, that credit may not reflect on your bill until the July or August statement, depending on your DISCOM’s reconciliation schedule. Before assuming your system underperformed, check whether the credit simply hasn’t posted yet.
Compare the “units exported” figure on your bill against your inverter’s own export log for the same period. A meaningful gap between the two, not explained by timing, suggests a metering or DISCOM crediting error rather than a system fault. SouthFace Solar’s diagnostic approach for reading production kWh against bill kWh is a useful cross-check regardless of which utility you’re on.
Seasonal banking rules also matter. Some Indian states settle net metering annually rather than monthly, so a summer surplus may only get credited at year-end. If that’s your state’s rule, a high bill in isolation during a low-sun month is expected, not a fault.
4. Confirm Panel Output Against Expected Generation for Your System Size
Every system size has a rough expected daily generation range based on local irradiation. A 5kW system in most of India should produce somewhere between 18-22 units a day in good sun, less in monsoon months. If your dashboard consistently logs 12-14 units, something is dragging performance down well before you’d expect normal degradation to matter.
Standard panel degradation runs around 0.5-0.8% per year, so a five-year-old system should still be producing 95%+ of its original output. A drop of 20% or more inside a year or two is not typical aging, it’s a fault worth investigating. Our guide on why solar generation drops suddenly lists the seven most common culprits, from shading to grid curtailment.
Why Does Solar Production on Paper Not Match Savings in Practice?
Production and savings diverge because a bill reflects how well your usage timing lines up with your generation, not just how many units you made. A system can hit its modeled kWh target and still deliver disappointing savings if most of that power is exported at low compensation rates while you buy back grid power at full price during evening peak hours.
This is a measurement gap, not a hardware failure, a distinction Tariform’s analysis of on-plan production with lower savings lays out clearly. Production monitoring confirms generation. It doesn’t check whether that generation actually offset your specific consumption pattern.
Fixed charges, demand charges, and time-of-use rate structures all sit on top of this. Even a perfectly performing system can’t erase a fixed monthly charge your DISCOM applies regardless of how little grid power you draw.
5. Rule Out Rate Plan and Tariff Changes
Before blaming the system, check whether your per-unit tariff itself changed. DISCOMs across India revise slab rates periodically, and a rate hike between billing cycles can offset genuine solar savings entirely. Compare the per-unit rate on your current bill against the bill from before installation, not just the total amount due.
Also check fixed and demand charges. Commercial connections in particular often carry a demand charge based on peak load that solar generation doesn’t reduce unless the system is sized and timed to shave that specific peak. Enervio’s explainer on bills staying high after solar covers how rate design, not equipment failure, drives a large share of these cases.
6. Check for Shading, Soiling, and String Faults on Site
If the data checks above don’t explain the gap, walk the site. New shading from a tree that’s grown taller, a nearby construction crane, or even a new neighboring rooftop structure can quietly cut output on specific strings without tripping any fault code. Our shading loss diagnosis guide covers how to confirm this against monitoring data before assuming it’s the cause.
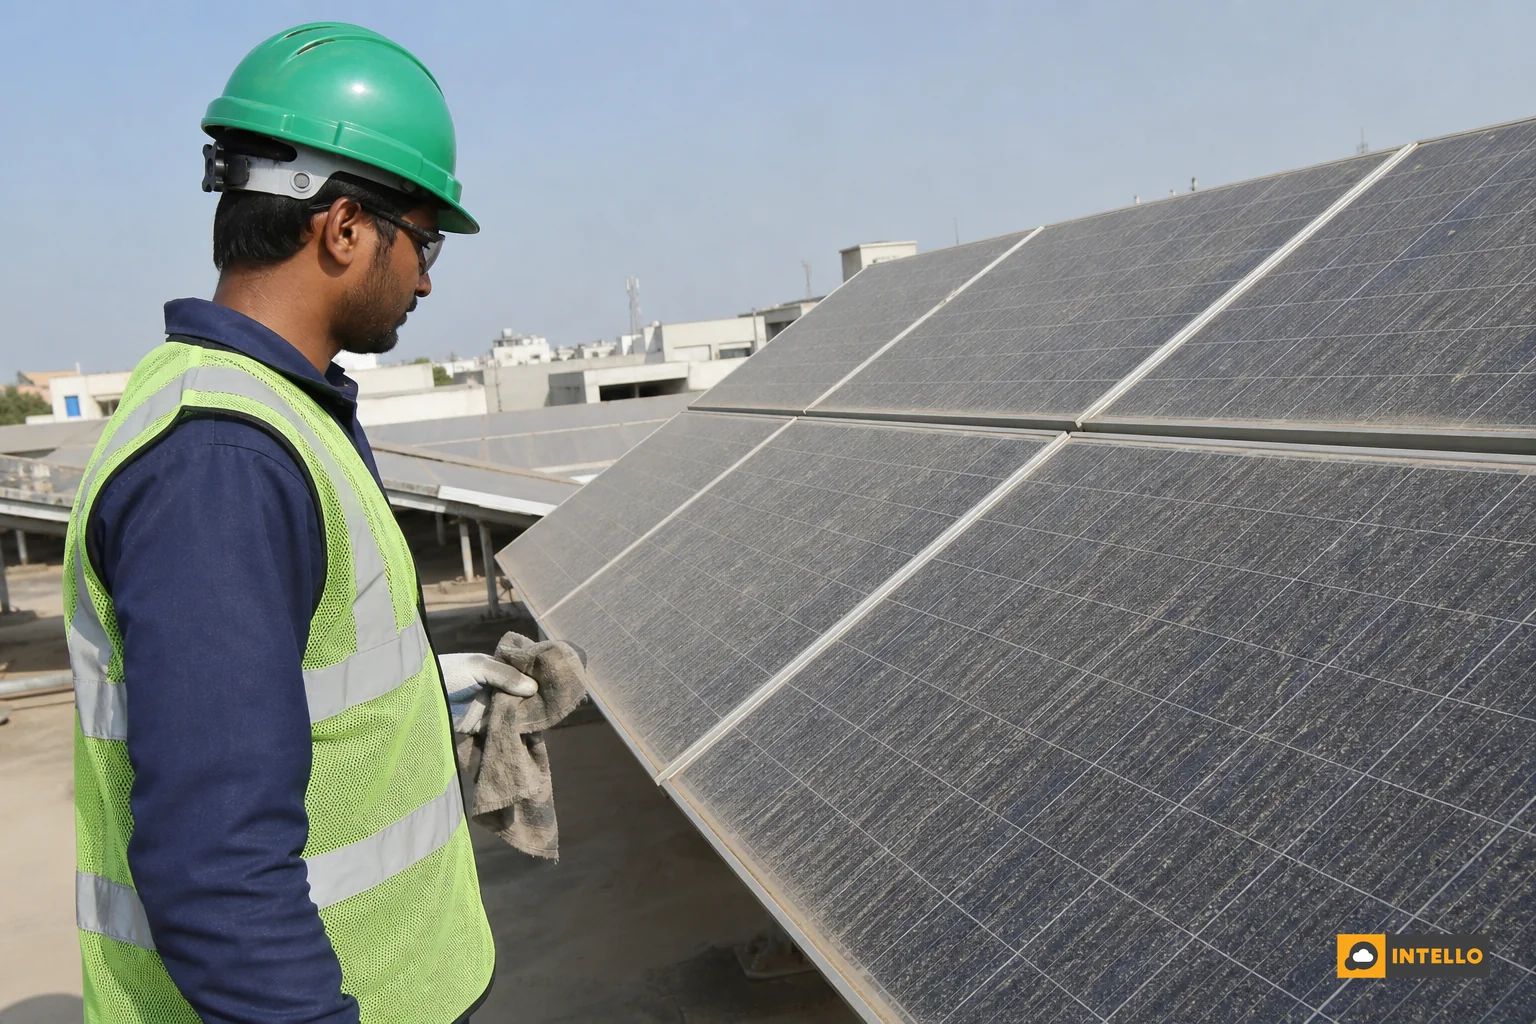
Soiling is the other frequent physical cause, especially in dry regions of India where dust settles fast between rains. A visibly hazy panel surface can cut output by 10-15% on its own. Check our regional cleaning guide for India to see how often your climate zone needs attention, and inspect strings for physical damage, loose connectors, or bird droppings while you’re up there.
When Should You Call a Professional O&M Team?
Call a professional once generation stays below 80% of your system’s expected range for more than a week, after you’ve ruled out billing lag and tariff changes. At that point the cause is almost always electrical (a string fault, connector corrosion, or inverter fault) and needs on-site diagnostic equipment, not another app screenshot.
A qualified O&M provider can run string-level current checks, thermal scans, and inverter diagnostics that a homeowner or facility manager can’t replicate from a dashboard. Waiting too long on an unresolved fault compounds the loss, since every extra week is billed at full grid rate with no solar offset.
Solar System Size vs Typical Monthly Bill Reduction
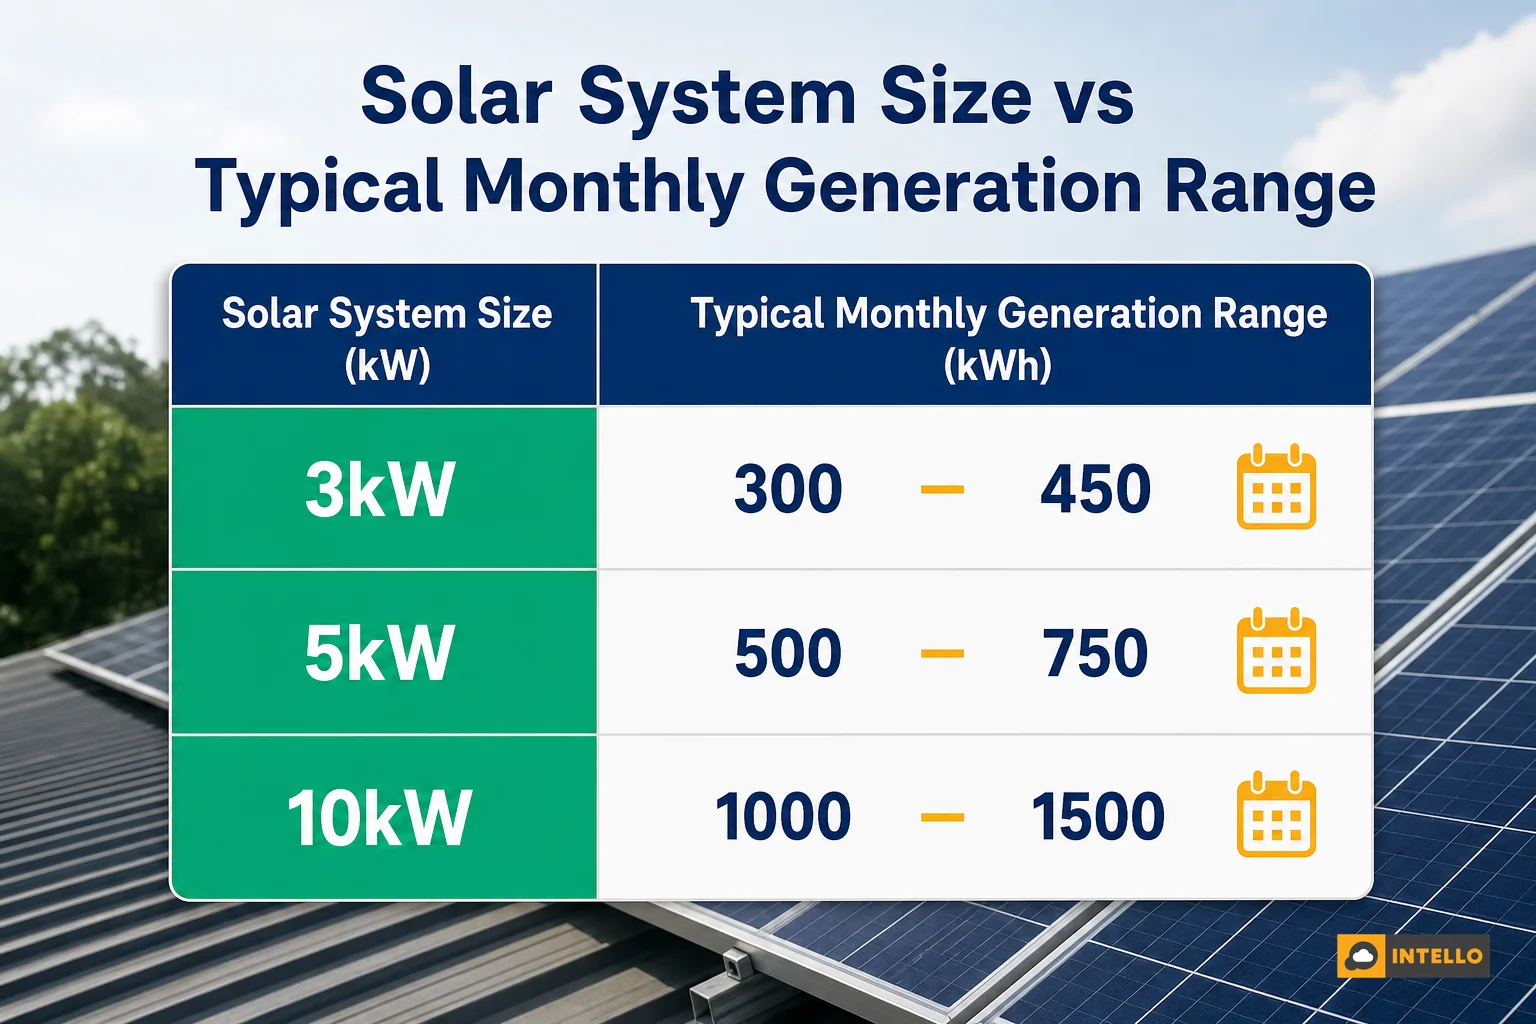
| System size | Typical monthly generation (good sun months) | Typical bill reduction driver |
|---|---|---|
| 3kW | ~330-400 units/month | Mostly offsets daytime household load; savings depend heavily on daytime usage habits |
| 5kW | ~550-660 units/month | Covers most of a mid-size home’s grid draw if usage is spread across the day |
| 10kW | ~1,100-1,320 units/month | Common for small commercial loads; savings depend on demand charge structure |
| 50kW+ | ~5,500-6,600 units/month | Commercial/industrial; export compensation rate and captive use ratio drive final savings |
These are rough irradiation-based estimates. Your specific location, tilt, shading, and monsoon exposure will move these ranges, which is exactly why comparing your own logged output against your own system’s baseline matters more than any generic figure.
Frequently Asked Questions
Why is my solar app showing good production but my bill is still high?
Your app measures total generation, while your bill only measures what crossed the meter, so a high app number and a high bill can coexist if most of your usage happens outside daylight hours when the panels aren’t producing.
How long does it take for net metering credits to reflect on my bill?
Most DISCOMs post export credits on the next billing cycle after export happens, though some states settle annually rather than monthly, so check your specific state’s net metering policy before assuming a credit is missing.
Can dirty panels alone cause a bill to stay high?
Yes. Soiling alone can cut output by 10-15% in dusty regions, and combined with a billing cycle lag or a minor string fault, that loss is often enough to erase the savings a homeowner expected to see.
Get a Clear Answer Instead of Guessing
Running through app data, inverter logs, net metering statements, and a site walk covers most causes behind a solar bill not reduced after installation. When the numbers still don’t add up, or you’d rather not spend a weekend cross-checking spreadsheets, request a quote from Intello’s O&M team for a proper diagnostic visit backed by IoT monitoring and on-ground technicians.
If you already have a monitoring setup, check your Intello portal login for the fault logs and performance history covered in this guide before your next bill arrives. And if you’re still comparing O&M providers or want to understand what full-service monitoring and maintenance actually looks like, learn more about how Intello protects solar ROI across 150+ sites in India.