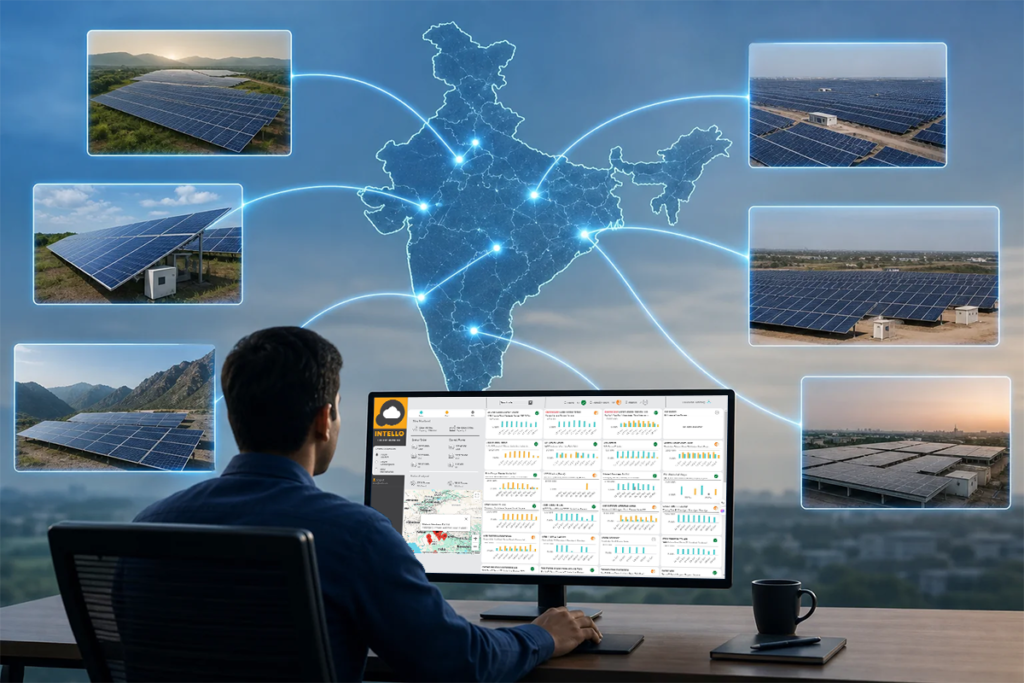
A generation drop from shading looks almost identical to a string fault on a monitoring dashboard. But the fix is completely different. Solar panel shading loss diagnosis means confirming, through monitoring data plus a physical site check, that a shadow is causing the loss. Do this before you call a technician for a repair that isn’t needed. Get this sequence right and you save a truck roll. Get it wrong, and a real wiring fault sits unfixed while you trim a tree.
Key Takeaways
- Shading loss repeats on a clock: a real shading problem drops output at the same time window every clear day. A wiring or inverter fault is usually random or constant.
- Small shadows cause outsized loss: shading as little as 10% of a string can cut string-level output by 30-50%, according to SurgePV’s shading analysis guide.
- A single shaded cell can drag down a third of a panel’s output. This happens because of how modules are wired into electrical sections, per Maysun Solar’s research on partial shading.
- The clamp meter test is decisive: cover a suspect module and watch string current on a DC clamp meter. This confirms shading in minutes, a technique detailed by Smart Roof Solar’s module detection guide.
- Diagnose before you dispatch: run the four-step sequence below before booking a repair visit. This avoids paying a technician to confirm what your dashboard and a five-minute site walk could already tell you.
At a Glance: Shading Loss Diagnosis Facts
| Factor | Typical detail |
|---|---|
| Shading extent that triggers major loss | Around 10% of a string shaded can cut string output 30-50% |
| Panel-level loss from a small shaded section | Up to roughly one-third of a single module’s output |
| Time signature | Loss repeats at the same clock time on clear days, shifting slowly with the seasons |
| Fastest confirmation method | Controlled shading test with a DC clamp meter on the suspect string |
| Common shading sources | Water tanks, adjacent buildings, trees, antennae, new construction, parapet walls |
| Contrast signal for wiring/inverter faults | Loss is constant, random, or paired with an inverter fault code, not tied to sun position |
| Who to call once shading is confirmed | An O&M team that can advise trimming, relocation, or string reconfiguration |
Why Shading Is Easy to Misdiagnose as a Wiring or Inverter Fault
Shading loss and electrical faults produce a similar symptom: less energy on the meter than expected. That’s where the resemblance ends. But many owners stop looking the moment they see a lower number.
Panels are wired in series within a string. Each module is split into two or three electrical sections joined by bypass diodes. When one cell in a section is shaded, that entire section can drop to near zero output. The string’s current then gets pulled down to match its weakest link. A shadow covering a fraction of one panel can cost far more than its share of the area. That’s exactly why Maysun Solar’s partial shading research found a power loss close to a third of module output from a small shaded area.
Owners jump to “inverter fault” because the drop shows up plant-wide on a summary chart. Drilling into string-level data usually tells a different story: one or two strings underperforming while the rest of the plant runs normally. That pattern points at a physical obstruction, not electronics.
Read our guide on how IoT sensors detect solar faults for a broader look at what remote monitoring can catch before it costs you generation.
1. Pull Your Monitoring Data First
Start with your dashboard, not the roof. Open string-level or panel-level data if your monitoring setup supports it. Compare each string’s output against the plant average for the same hour.
A shading problem shows up as one or two strings consistently lagging. An inverter fault usually shows up as an entire inverter’s output falling, or a fault code in the log. If you only have plant-level data, consider a more granular setup now. Guesswork at this stage wastes the rest of the diagnosis. Our guide on what a solar dashboard should show daily covers the exact metrics worth watching.
Compare today’s curve against a baseline day from a similar season last year, if your platform stores history. A shading-caused dip shows a notch at a specific hour that wasn’t there in the earlier baseline curve. That’s a strong early signal before you even leave your desk.
2. Check Whether the Loss Pattern Repeats at the Same Time Daily
A real shading problem drops output at the same clock time on every clear day. This happens because the sun’s path across the sky repeats daily and shifts only gradually with the seasons. This time-signature is the most reliable way to separate shading from an electrical fault, before you inspect anything physically.
Pull three to five consecutive clear-weather days from your monitoring history and overlay the generation curves. If a dip appears at, say, 9:15 am to 10:00 am every single day, that’s an obstruction to the east of the array casting a morning shadow. If the dip moves around, appears only on some days, or lines up with an inverter restart, you’re likely looking at a wiring or electronics issue instead.
Seasonal drift matters too. A shadow that clips panels for twenty minutes in December may barely touch them in June, because the sun sits higher and the shadow angle changes. If a client reports a “new” problem every winter, that’s often the same obstruction reappearing on schedule, not a fresh fault.
3. Walk the Site and Look for the Obstruction
Confirm the time-of-day signal by walking the array at the exact clock window flagged in your monitoring data. Look for whatever is casting a shadow onto the underperforming string.
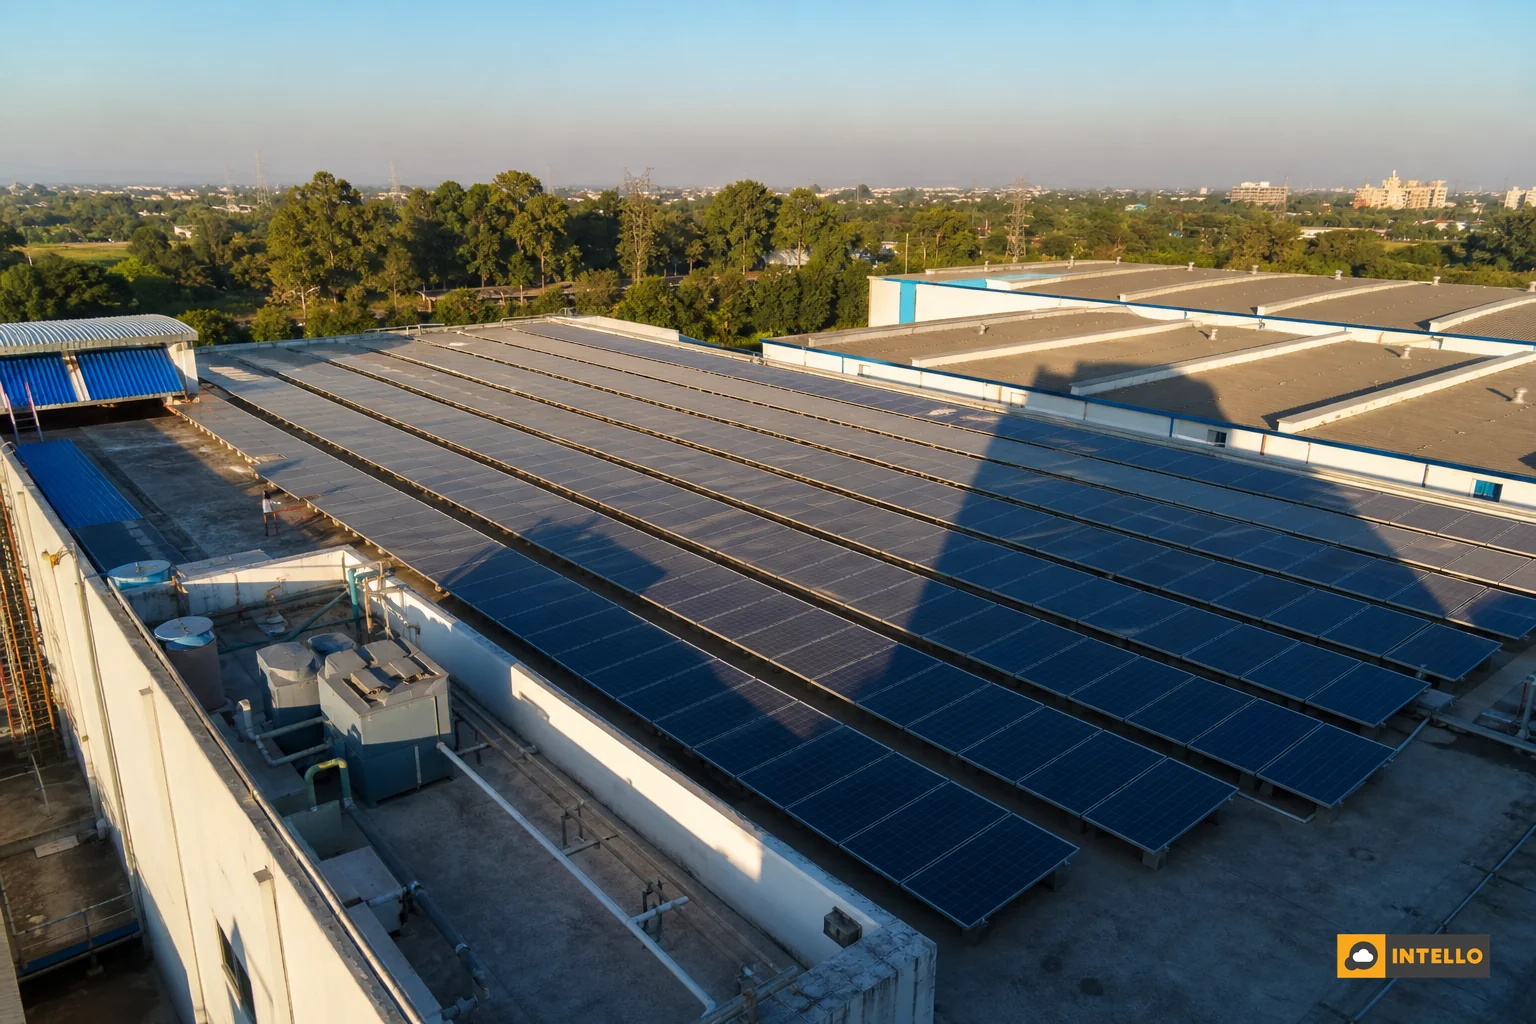
Common culprits on Indian rooftops include overhead water tanks, adjoining building parapets, rooftop antennae, DG set exhaust stacks, and neighboring structures built after the array was commissioned. On ground-mounted plants, fast-growing trees along the boundary fence are the usual offender, alongside transmission towers or nearby sheds.
For larger sites, walking every row isn’t practical. A drone pass at the flagged time window, or a satellite image comparison against the original layout drawings, can locate the obstruction faster than a physical walkthrough across several acres. Our ground-mounted maintenance checklist covers the site-inspection routine in more depth for larger installations.
Note the exact panel row and column affected, and photograph the obstruction with a timestamp. That record becomes useful evidence if you later need to negotiate a tree-trimming request with a neighbor or building society.
4. Run the Controlled Shading and Clamp Meter Test
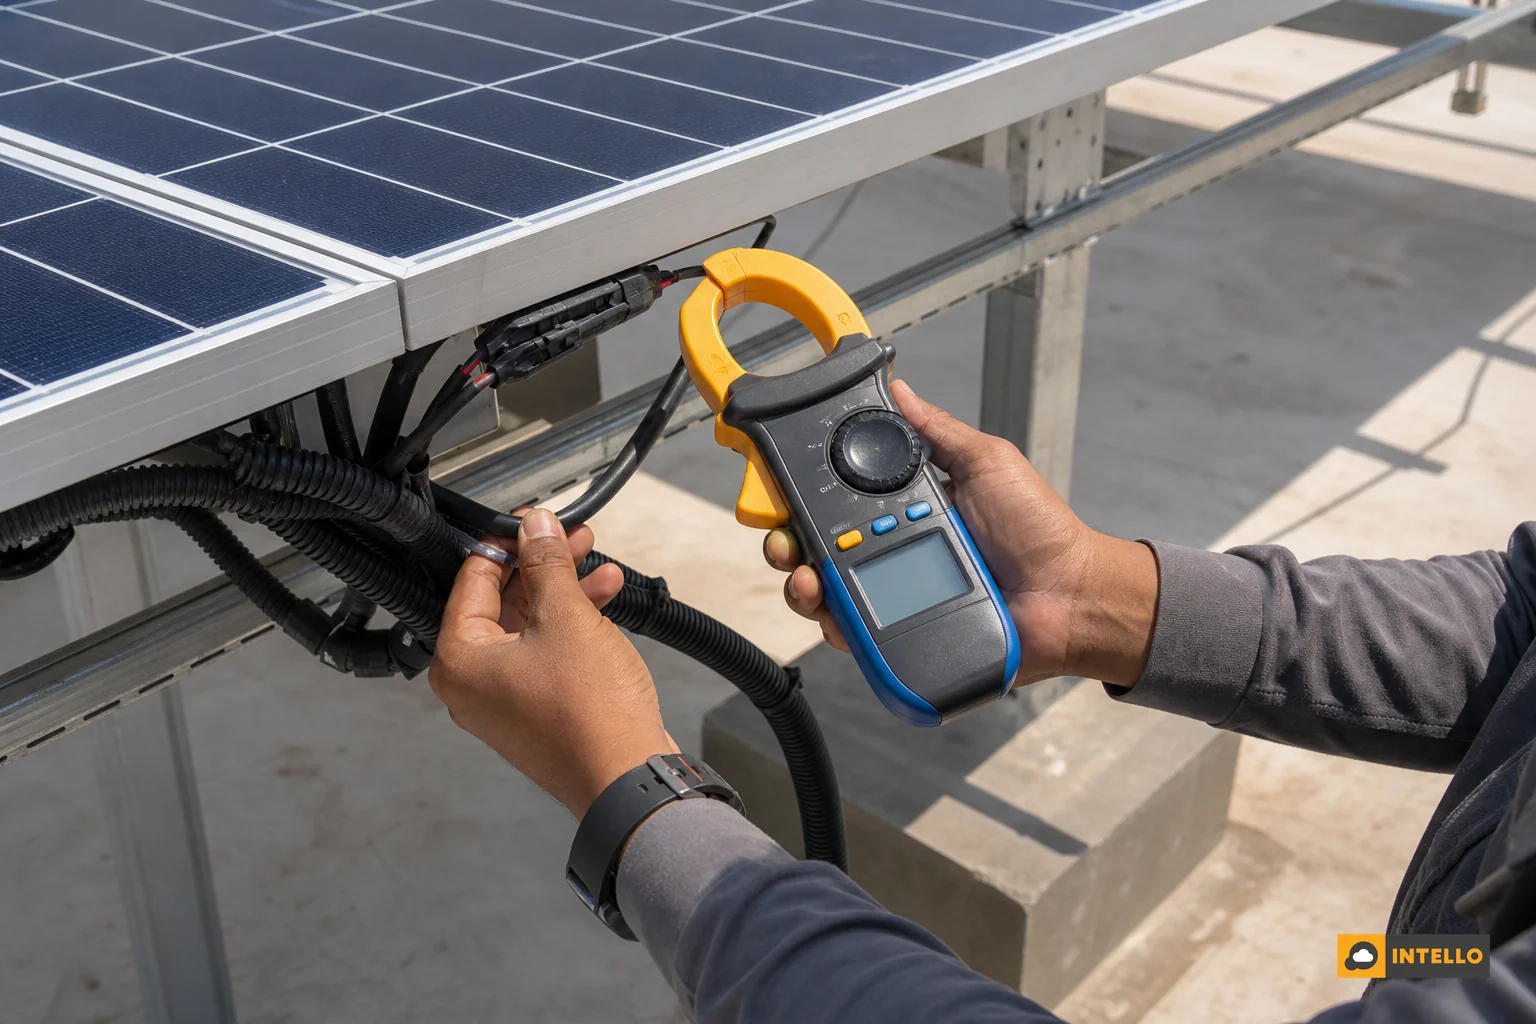
Once you’ve located a likely obstruction, confirm it electrically before scheduling any repair. Field technicians do this with a controlled shading test combined with a DC clamp meter reading on the affected string. This method is described in detail by Smart Roof Solar’s faulty module detection guide.
The process is straightforward. Clamp the meter onto the string’s DC output and record the baseline current in full sun. Then briefly cover the suspect module with an opaque sheet, cardboard, or tarp, and watch the current reading again. If the string current drops sharply and recovers the moment you remove the cover, that string is reacting normally to shade. Your earlier suspicion of a physical obstruction is confirmed.
If covering the module produces little to no change in current, or the string was already reading low before you covered anything, the problem likely sits in the wiring, connectors, or a failing bypass diode rather than shading. That distinction changes what you tell your repair technician when you call. It can save an unnecessary visit for the wrong root cause.
Shading vs Wiring vs Inverter Fault: How to Tell Them Apart
Each cause leaves a different signature across monitoring, timing, and physical evidence. This table summarizes what to expect from each.
| Symptom | Shading loss | Wiring/connector fault | Inverter fault |
|---|---|---|---|
| Affected scope | One or two specific strings | One string or a single module | Everything on that inverter’s inputs |
| Time pattern | Repeats at same clock time daily | Constant or intermittent, not tied to sun position | Constant, or paired with a fault code |
| Clamp meter test result | Current drops and recovers with covering/uncovering | Current stays low regardless of shading | Current absent or erratic at the inverter input |
| Physical evidence | Visible obstruction casting a shadow at the flagged time | Loose connector, corrosion, or damaged cable | Fault code, tripped breaker, or heat damage on inverter |
| Seasonal behavior | Shifts with sun angle across the year | Unaffected by season | Unaffected by season |
| Typical fix | Trim, relocate obstruction, or reconfigure strings | Reterminate or replace wiring/connector | Inverter servicing or component replacement |
Our inverter troubleshooting guide goes deeper into fault codes and inverter-specific symptoms if your diagnosis points that way instead.
How Much Output Can Shading Actually Cost You?
Shading loss doesn’t scale evenly with the shaded area. That’s the part most owners underestimate. Even 10% shading on a string can reduce that string’s output by 30-50%, according to SurgePV’s solar shading analysis guide. This happens because the shaded cells drag the entire string’s current down to match the weakest module.
At the panel level, a shadow covering just a fraction of one module can knock out an entire electrical section. That costs close to a third of that panel’s output, as shown in Maysun Solar’s partial shading study. Left unaddressed, persistent shading also raises the risk of localized heating in the shaded cells, sometimes called hot spots. This can shorten module life over time.
For a commercial plant billing on generated units, a shaded string running at half its expected output for two to three hours a day adds up over months. This is a real hit to ROI. It’s one of several causes behind the broader question of why solar bills stay high after installation, alongside soiling and inverter derating.
Fixing Shading Once You’ve Confirmed It
Once the clamp meter test confirms shading as the root cause, the fix depends on what’s casting the shadow. It also depends on whether it’s on your property or a neighbor’s.
Trimming vegetation is usually the fastest fix when trees are the culprit. Schedule it before the growth cycle repeats the problem next year. If the obstruction is a fixed structure, like a water tank or parapet wall, relocating the affected panels or adding module-level power electronics can help. This limits the current-matching penalty on that string and can recover most of the lost output without a full redesign.
For strings that are permanently and predictably shaded at certain hours, some plants benefit from reconfiguring which modules share a string. This keeps the shaded row from dragging down modules that stay in full sun. This kind of change is best handled by a maintenance provider familiar with your inverter’s MPPT behavior, not as a DIY rewiring project.
A shading fix that isn’t paired with an updated maintenance schedule tends to recur. New shading sources, from a neighbor’s construction to a fast-growing tree, show up every year on plants that never get revisited.
If your plant already runs on an AMC, ask whether shading checks are part of the scheduled visits, not just cleaning. Our guide on what’s included in a solar AMC contract flags this exact gap as a common red flag in the fine print.
FAQ
How do I know if my solar panel loss is from shading?
Check whether the output drop repeats at the same clock time on clear days and affects only one or two strings on your dashboard. Confirm it by covering the suspect module and watching string current change on a DC clamp meter, as detailed in this diagnosis sequence.
Does shading damage solar panels permanently?
Repeated shading itself doesn’t damage a module directly. But the localized heating it causes in shaded cells, known as hot spots, can speed up degradation over years if the shading pattern is never fixed.
How often should I check for new shading on my solar plant?
Walk the site or review satellite imagery at least twice a year. New construction, growing trees, and rooftop equipment additions can introduce shading that wasn’t present at commissioning. Many owners in India pair this check with seasonal cleaning visits described in our regional solar cleaning guide by climate zone.
Diagnosing shading correctly before you book a repair visit saves you from paying for a technician to fix a problem that was never electrical to begin with. Intello’s monitoring dashboard already surfaces the string-level and time-of-day patterns this diagnosis sequence relies on. Our field technicians carry the clamp meters to confirm it on-site the same day. Request a quote to get a shading and string health review scheduled for your plant, or check your own string-level trends right now through the Portal Login. If you’re still comparing O&M providers for this kind of diagnostic depth, our About page outlines how our 150+ field technicians and centralized dashboard work together across Indian sites.