Picture this: a factory owner in Pune opens his solar monitoring portal every morning, sees a green checkmark next to “System Online,” and closes the tab. His 200 kW rooftop installation has been running for two years. He has never missed a payment on his AMC. Yet his electricity bills have been creeping up for the past four months — and nobody flagged it.
The system was online. But three strings had been underperforming by 18% since the last monsoon, quietly eroding his savings. His solar dashboard had the data. He just didn’t know which numbers to look at.
This guide is for solar asset owners across India who have a monitoring dashboard but aren’t sure which metrics actually matter day-to-day. We’ll walk through exactly what your dashboard should display, how to interpret each reading, which red flags demand immediate escalation, and how an IoT-enabled platform like Intello’s can automate much of this work for you — whether you manage one rooftop or a portfolio of sites.
Why Most Solar Owners Are Reading Their Dashboard Wrong
The most common mistake solar asset owners make is treating their dashboard like a power meter. They check total generation, confirm the number is “roughly what it should be,” and move on. This approach misses the point of monitoring entirely.
A solar dashboard is not just a readout — it is a diagnostic tool. The difference between a system that is “on” and a system that is “healthy” can represent tens of thousands of rupees in lost generation annually. Dust accumulation, a failing bypass diode, a loose DC connector, or an inverter running at reduced efficiency can all keep your system technically operational while silently cutting your output by 10 to 25%.
In India’s solar market, where installations face extreme heat, monsoon humidity, dust from construction and agriculture, and frequent grid fluctuations, the gap between “online” and “optimal” is wider than in most other markets. A well-configured dashboard surfaces that gap every single day. A poorly read one hides it.
The sections below break down the specific metrics, alerts, and patterns that separate a dashboard that protects your investment from one that merely displays data.
The 7 Metrics Your Solar Dashboard Must Show Every Day
Not every number on your monitoring interface carries equal weight. These seven metrics form the daily minimum for any solar asset owner who wants genuine visibility into system health.
1. Real-Time Generation (kW) vs. Cumulative Generation (kWh)
Real-time generation tells you how much power your system is producing right now. Cumulative generation tells you how much it has produced over a period. Both matter, but for different reasons. Real-time data helps you catch sudden drops during peak hours. Cumulative data helps you track monthly and annual yield against projections. Your dashboard should display both, with real-time data refreshing at least every 15 minutes.
2. Performance Ratio (PR)
This is the single most important metric on your dashboard. PR compares your actual output to the theoretical maximum output given the available sunlight. A healthy system in Indian conditions typically maintains a PR between 75% and 82%. A drop below 70% is a clear signal that something is wrong. We cover PR in detail in the next section.
3. Specific Yield
Specific yield (measured in kWh/kWp) benchmarks your system’s output against its installed capacity. It allows fair comparison across systems of different sizes and helps you identify whether underperformance is a system-wide issue or isolated to specific components.
4. Grid Export vs. Self-Consumption
For commercial installations with net metering, this split shows how much energy you are consuming on-site versus feeding back to the grid. Unexpected shifts in this ratio, for example, a sudden drop in export, can indicate a generation problem or a change in load patterns worth investigating.
5. Irradiance Data
Without irradiance context, generation numbers are meaningless. A system producing 150 kWh on a cloudy day may be performing excellently. The same output on a clear day in May is a red flag. Your dashboard should display irradiance (W/m²) alongside generation so you can contextualize every reading.
6. Inverter Efficiency and Operating Status
Your inverter’s real-time efficiency percentage and operational status (running, standby, fault, offline) should be visible at a glance. Efficiency dropping below 95% on a modern string inverter warrants attention. Any fault or offline status during daylight hours requires immediate investigation.
7. String-Level Current and Voltage
This is where most basic dashboards fall short. String-level data shows the current and voltage output of each individual string of panels. Deviations between strings are the earliest detectable signal of soiling, shading, panel failure, or connector issues. If your dashboard doesn’t show string-level data, you are flying partially blind.
Understanding Performance Ratio: Your Daily Health Score
Performance Ratio is the closest thing solar monitoring has to a single daily health score. It strips out the effect of weather and tells you how efficiently your system is converting available sunlight into usable electricity.
How PR Is Calculated
The formula is straightforward: PR = (Actual Energy Output in kWh) ÷ (Installed Capacity in kWp × Irradiance in kWh/m²). A system with 100 kWp capacity, receiving 5 kWh/m² of irradiance, has a theoretical maximum output of 500 kWh. If it actually produces 400 kWh, its PR is 80%. That is a healthy number for most Indian installations.
What a Healthy PR Looks Like in India
Indian solar installations typically operate in the following PR ranges:
- Above 80%: Excellent, system is well-maintained and performing near its potential
- 75, 80%: Good, normal operating range for most commercial systems
- 70, 75%: Acceptable, worth monitoring closely; may indicate early soiling or minor losses
- Below 70%: Concerning, investigate immediately; likely soiling, shading, equipment fault, or wiring loss
PR benchmarks also vary by climate zone. Systems in Rajasthan and Gujarat, where irradiance is high but dust accumulation is severe, may show lower PR during dry months. Systems in coastal Karnataka or Kerala may show higher PR during clear post-monsoon periods. Your dashboard should ideally allow you to compare current PR against your own historical baseline, not just a generic industry average.
Why PR Drops Are More Telling Than Raw Generation Drops
Raw generation can drop simply because it’s a cloudy day. PR drops on a clear day tell a different story. A PR that falls from 79% to 71% over three consecutive sunny days is a strong signal of soiling, a developing string fault, or inverter degradation, regardless of what the total kWh number looks like. This is why PR should be the first metric you check each morning, not the last.
For a deeper look at how monitoring system selection affects your ability to track PR accurately, see our guide on how to choose a solar monitoring system in 2026.
String-Level Data: Where Hidden Faults Live
Ask any experienced solar O&M engineer where the most costly undetected faults hide, and the answer is almost always the same: at the string level.
A string is a series of solar panels connected in sequence. Most commercial installations have multiple strings feeding into a combiner box or directly into a string inverter. Inverter-level data tells you the total DC input, but it averages across all strings. A string producing 60% of its rated current can be masked by three healthy strings producing 100%, leaving the inverter’s aggregate numbers looking acceptable.
What String Current Imbalance Signals
When one string’s current reading deviates more than 10% from the others under identical irradiance conditions, it is an early fault signal. Common causes in Indian conditions include:
- Differential soiling: One string shaded by a parapet wall, water tank, or bird droppings while others remain clean
- Bypass diode failure: A failed diode in one panel causes the entire string to underperform
- Loose or corroded MC4 connectors: Particularly common after monsoon season in coastal and high-humidity regions
- Panel mismatch or degradation: One or more panels in a string degrading faster than the rest
- Partial shading from new obstructions: New construction, tree growth, or equipment installed near the array
What a Healthy String Profile Looks Like
On a clear day at peak irradiance, all strings in the same array should show current readings within 5% of each other. Voltage readings should be nearly identical across strings of the same length. Any consistent outlier, a string that is always 15% lower than its neighbors, deserves investigation, not just monitoring.
String-level visibility is non-negotiable for commercial assets above 50 kW. For smaller residential systems, at minimum your dashboard should show per-MPPT data from your inverter, which provides a partial view of string-level performance.
For a comprehensive breakdown of string fault types, detection methods, and repair approaches, our detailed resource on solar monitoring systems covers the diagnostic workflow in depth.
Inverter Health Indicators to Check Daily
Your inverter is the most mechanically complex component in your solar system and the most likely to generate actionable alerts on your dashboard. Knowing which indicators matter, and what they mean, is essential for any asset owner.
Key Parameters to Monitor
- AC Output Power (kW): Should match expected generation given current irradiance
- DC Input Voltage and Current: Should align with string-level readings; large discrepancies indicate wiring or combiner box issues
- Inverter Internal Temperature: Most string inverters operate safely up to 45, 55°C ambient. In Indian summers, thermal derating, where the inverter reduces output to protect itself, is common and should be visible on your dashboard
- Conversion Efficiency (%): Modern string inverters should operate at 97, 98.5% efficiency. Consistent readings below 95% indicate a servicing need
- Grid Voltage and Frequency: Deviations from 230V / 50Hz can cause inverter trips and should be logged for grid fault documentation
Error Codes and Fault Flags
Every inverter manufacturer uses a proprietary error code system, but most faults fall into a few categories your dashboard should clearly distinguish:
- Grid faults: Overvoltage, undervoltage, frequency deviation, caused by grid instability, not your system
- DC faults: Insulation resistance low, DC overcurrent, often indicate wiring issues or panel degradation
- Inverter hardware faults: Fan failure, IGBT fault, communication error, require technician intervention
- Clipping events: When your panels produce more DC power than the inverter can convert, common in oversized systems and visible as a flat-top curve on your generation graph
A good dashboard doesn’t just log these codes, it translates them into plain-language alerts and assigns a severity level so you know whether to call your O&M team immediately or flag it for the next scheduled visit.
Red Flags on Your Dashboard: When to Escalate to Your O&M Team
Not every alert requires an emergency call. But certain patterns demand immediate escalation. Here is a practical framework for deciding when to act.
Escalate Immediately If You See:
- Zero generation during peak irradiance hours (10 AM, 3 PM on a clear day), inverter offline, main DC disconnect tripped, or complete string failure
- PR drop greater than 10% in a single day compared to the previous clear day, sudden soiling event, major equipment fault, or grid issue
- Repeated inverter restart events (3 or more in a single day), thermal issue, grid instability, or internal fault developing
- String current at zero while adjacent strings are healthy, open circuit fault, blown fuse, or complete string disconnection
- Insulation resistance alarm, potential safety hazard requiring immediate inspection
Flag for Next Scheduled Visit If You See:
- PR declining 3, 5% over 5, 7 consecutive days, likely soiling accumulation; schedule a cleaning visit
- String current deviation of 10, 15% persisting for more than 3 days, early fault developing; worth a technician inspection
- Inverter efficiency trending down over 2, 3 weeks, may indicate capacitor aging or cooling system issue
- Clipping events increasing in frequency, may indicate a need for system rebalancing
How to Communicate Flags to Your O&M Provider
When escalating, document the following from your dashboard: the date and time of the anomaly, the specific metric and its value, the baseline value for comparison, and any error codes displayed. A screenshot with timestamp is worth more than a verbal description. A professional O&M provider should have a clear escalation protocol, if yours doesn’t, that is itself a red flag worth addressing.
For guidance on evaluating whether your current O&M arrangement is structured to handle these escalations effectively, see our comparison of in-house vs outsourced solar O&M in India.
Managing Multiple Sites: What a Multi-Site Dashboard Should Show
For solar asset owners managing installations across multiple locations, whether that’s three commercial rooftops in different cities or a mix of ground-mounted and rooftop systems, a single-site dashboard is not enough. Portfolio-level visibility requires a different set of views.
Portfolio-Level Metrics
Your multi-site dashboard should provide:
- Aggregate generation across all sites with the ability to drill down to individual locations
- Site-by-site PR comparison, the fastest way to identify which location is underperforming relative to its peers
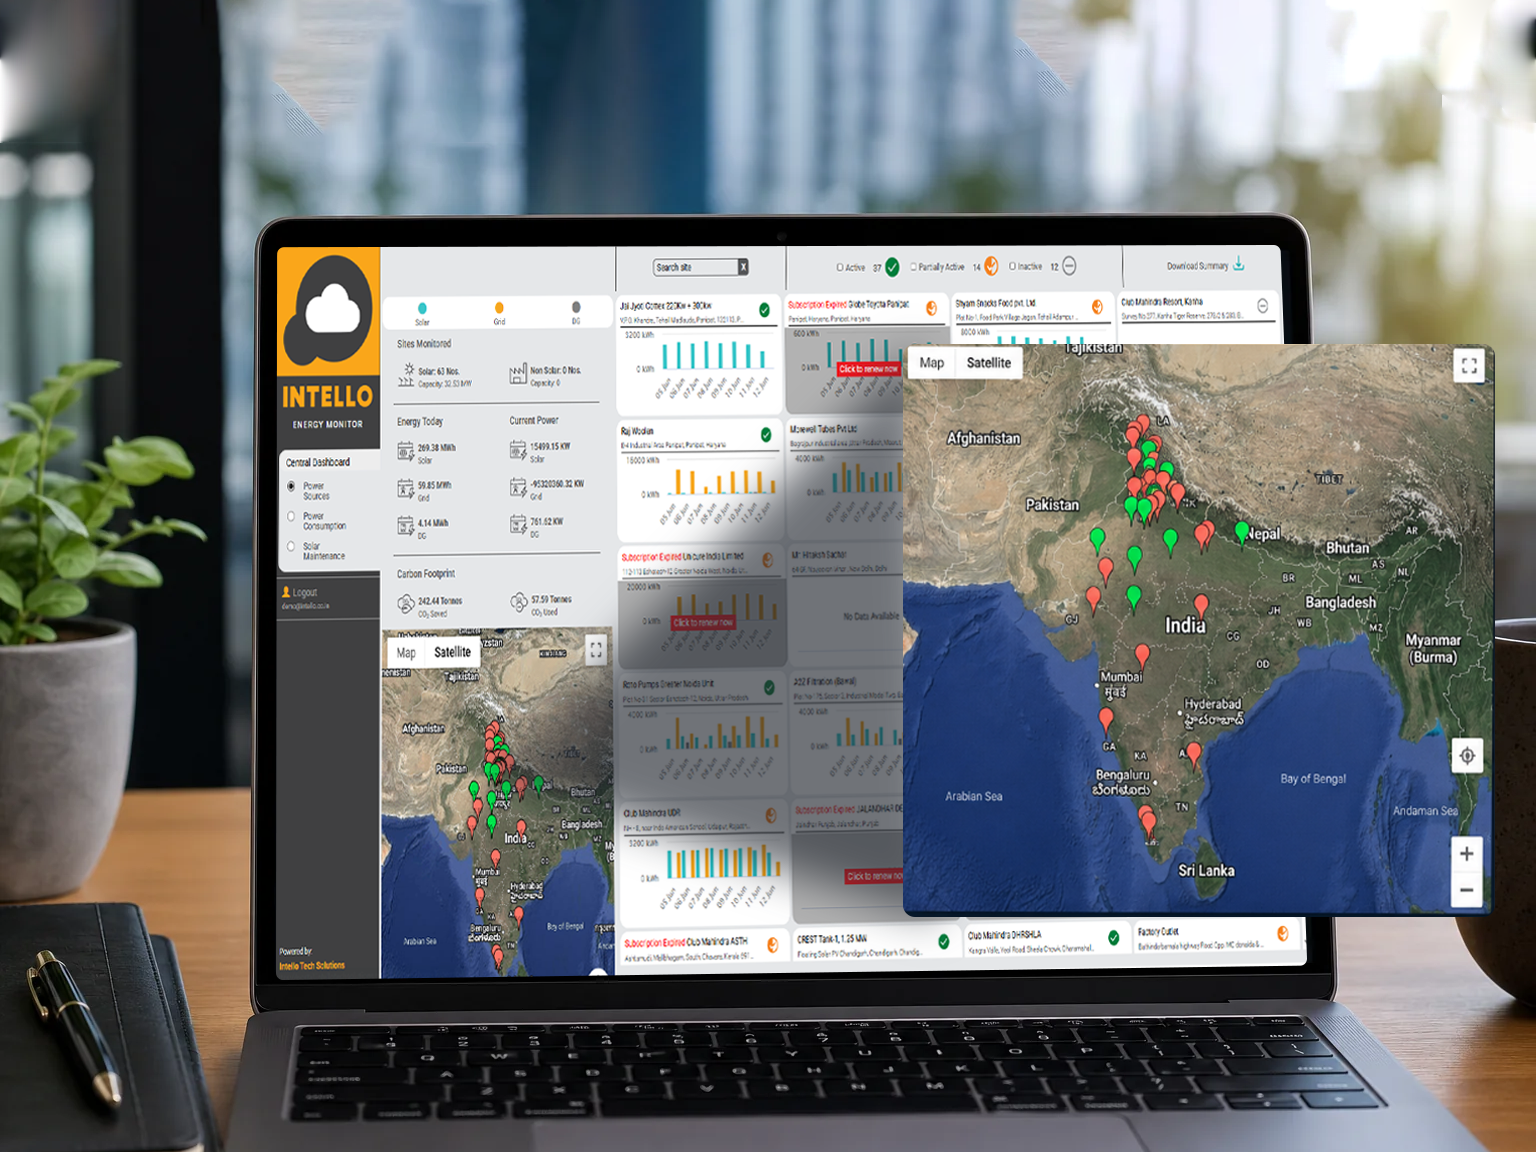
- Centralized alert feed, all fault alerts from all sites in a single, prioritized list
- Geographic map view, visual representation of site locations with color-coded health status
- Normalized performance comparison, accounting for different irradiance levels at each location so you’re comparing apples to apples
Why Single-Pane-of-Glass Visibility Matters
When alerts from different sites arrive through different channels, one site’s inverter sends an SMS, another’s data logger emails a CSV, a third requires manual login to a separate portal, response time suffers. Studies of commercial solar O&M operations consistently show that fragmented monitoring leads to longer fault-to-resolution times, which directly increases energy loss.
A centralized platform that aggregates all site data into one interface, with unified alerting and reporting, is not a luxury for multi-site owners, it is the foundation of effective asset management. This is particularly relevant for solar EPC companies managing post-installation O&M for multiple client sites across India.
How Intello’s Solar Dashboard Automates Fault Detection
Intello’s monitoring platform is built specifically for the realities of solar asset management in India, where dust, heat, grid instability, and geographic spread create monitoring challenges that generic international platforms don’t address well.
IoT-Enabled RTUs for Real-Time Data
At the core of Intello’s system are custom-designed Remote Telemetry Units (RTUs) installed at each site. These IoT devices collect data from inverters, string combiner boxes, weather sensors, and energy meters, then transmit it to the centralized platform in real time. Unlike basic data loggers that store and upload data in batches, Intello’s RTUs provide continuous data streams, meaning faults are detected in minutes, not hours.
Automated Alerts vs. Manual Log Review
The platform’s automated alert engine continuously compares live readings against configured baselines and thresholds. When a string current drops below its expected range, when an inverter’s PR falls outside normal bounds, or when a grid fault is detected, the system generates an alert automatically, without requiring anyone to log in and review data manually. Alerts are categorized by severity and routed to the appropriate team members.
This automation is particularly valuable for commercial asset owners who don’t have dedicated energy managers on staff. The dashboard does the watching; you only need to act when it tells you to.
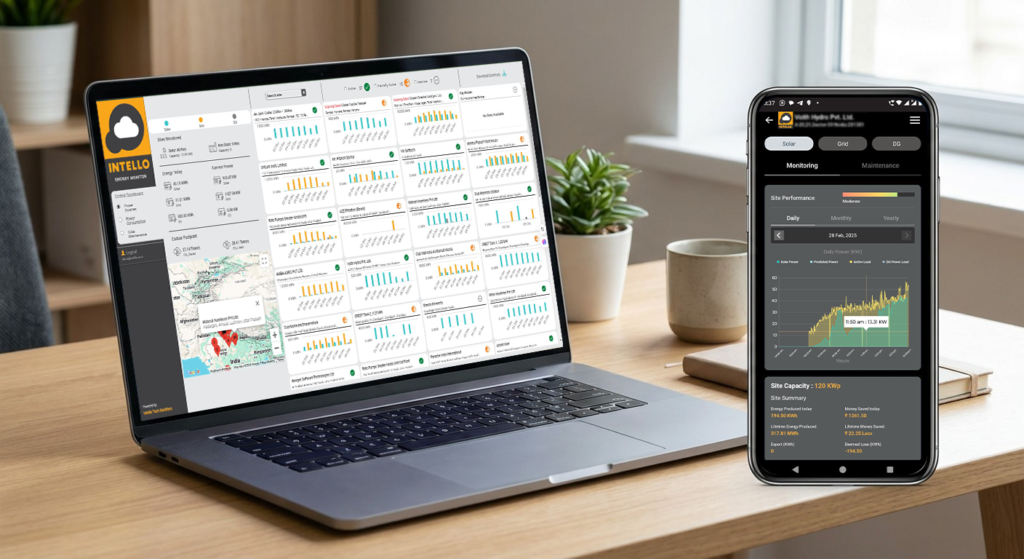
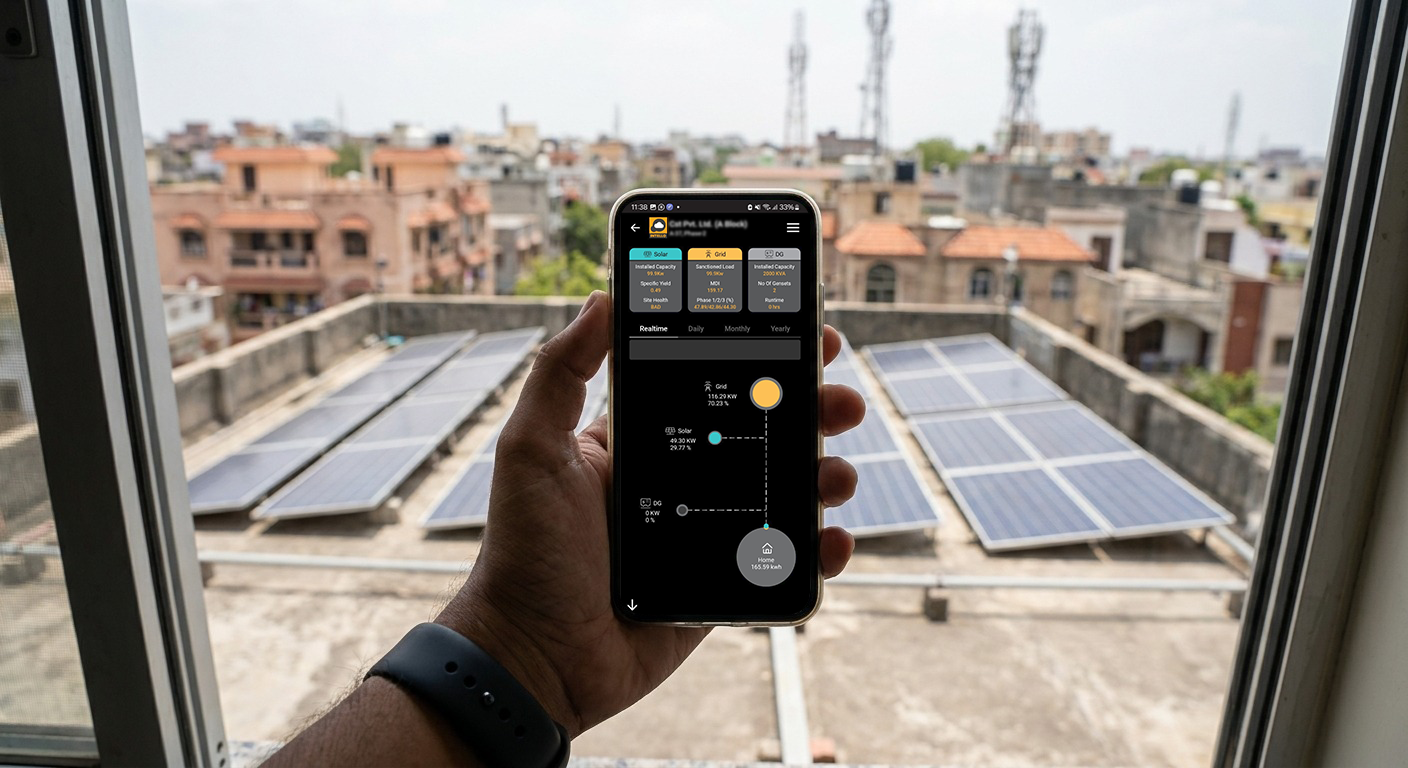
Mobile App Access for On-the-Go Monitoring
Intello’s mobile application gives asset owners and O&M managers full dashboard access from any location. The app includes location-stamped and timestamped maintenance reports, photographic documentation of completed work, and customer signature capture, creating a verifiable audit trail for every service visit. For asset owners managing sites across multiple cities, this level of transparency is essential.
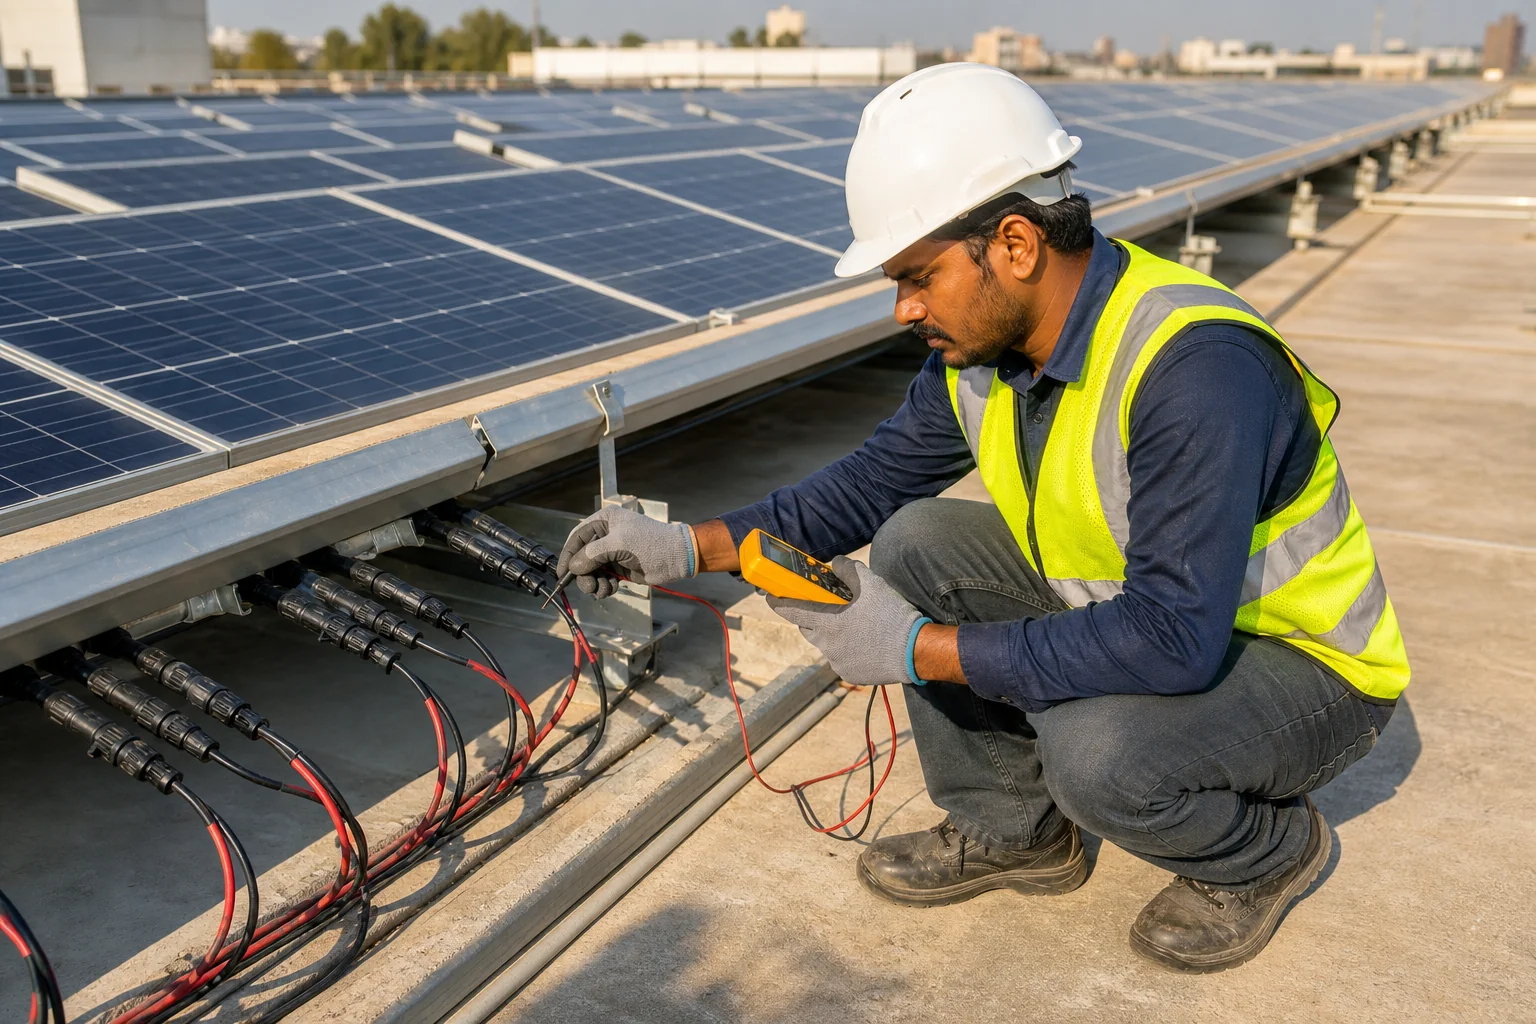
Integration with On-Ground O&M Teams
What separates a monitoring platform from a complete O&M solution is the connection between digital alerts and physical response. When Intello’s dashboard flags a fault, it doesn’t just send a notification, it triggers a workflow that dispatches a technician from Intello’s network of 150+ solar experts across India. The response is coordinated, documented, and tracked through the same platform.
This integration supports both preventive maintenance scheduling (inverter servicing, string balancing, hardware tightening, panel cleaning) and reactive repair workflows, ensuring that what the dashboard detects, the O&M team addresses. For asset owners on an Annual Maintenance Contract (AMC), this closed-loop system means fewer surprises and more predictable solar performance throughout the year.
To understand how regional climate conditions in India affect your maintenance and cleaning schedule, and how your dashboard data should inform those decisions, our regional solar cleaning guide by climate zone provides state-by-state context.
You can explore Intello’s monitoring capabilities and log into your existing portal at Intello’s monitoring portal, or learn more about Intello’s approach to integrated solar O&M in India.
Frequently Asked Questions About Solar Dashboards
How often should I check my solar dashboard?
For commercial installations above 50 kW, a daily morning check of PR, string status, and inverter health is recommended. For smaller residential systems, a weekly review is typically sufficient, provided your monitoring platform is configured to send automated alerts for critical faults. The goal is not to watch the dashboard constantly, but to ensure that significant deviations trigger an alert before you need to look for them.
What is a good Performance Ratio for India?
A PR of 75, 82% is considered healthy for most Indian solar installations. Systems in high-dust regions like Rajasthan may see PR dip to 70, 75% during peak summer months before cleaning. Coastal systems in Kerala or Tamil Nadu may achieve PR above 80% during clear post-monsoon periods. The most meaningful benchmark is your own system’s historical PR under similar irradiance conditions, not a generic national average.
Can my dashboard detect panel-level faults?
Standard string-level monitoring can detect faults at the string level, which typically means a group of 8, 20 panels. True panel-level fault detection requires module-level power electronics (MLPEs) such as microinverters or DC optimizers, or thermal imaging during a physical inspection. For most commercial installations in India, string-level monitoring provides sufficient granularity for cost-effective fault detection. Panel-level resolution is more commonly justified for large ground-mounted systems where individual panel replacement costs are significant.
What should I do if my dashboard shows zero generation?
First, confirm it is daylight hours and check the irradiance reading, if irradiance is also near zero, the system may simply be responding to heavy cloud cover. If irradiance is normal but generation is zero, check inverter status for fault codes. If the inverter shows a fault or is offline, contact your O&M provider immediately. Do not attempt to reset the inverter without guidance if you see an insulation resistance or DC fault code, as these can indicate a safety issue.
Does Intello’s dashboard work for both rooftop and ground-mounted systems?
Yes. Intello’s monitoring platform is designed to support residential rooftop systems, commercial rooftop installations, and large ground-mounted solar plants. The platform scales from single-site monitoring to multi-site portfolio management, with the same IoT-enabled RTU infrastructure and centralized alert system across all installation types. Configuration is adapted to the specific inverter brands, string configurations, and metering setups at each site.
Take Control of What Your Solar Dashboard Is Telling You
A solar dashboard that shows you the right metrics, PR ratio, string-level current, inverter health, irradiance-adjusted generation, is one of the most powerful tools an asset owner has for protecting their solar investment. One that only shows total kWh is little more than a digital meter.
The difference between the two is the difference between catching a string fault in week one and discovering it six months later when your electricity bills tell the story your dashboard should have told first.
If your current monitoring setup isn’t giving you the visibility described in this guide, or if you’re managing multiple sites and still logging into separate portals, it’s worth having a conversation about what a properly configured, IoT-enabled solar monitoring and O&M solution looks like for your specific assets.
Intello’s team works with commercial solar asset owners, residential system owners, and EPC companies across India to set up monitoring that actually works, and backs it with on-ground maintenance teams ready to respond when the dashboard flags a problem. Request a quote from Intello to find out how the right solar dashboard and O&M partnership can recover the performance your system should already be delivering.