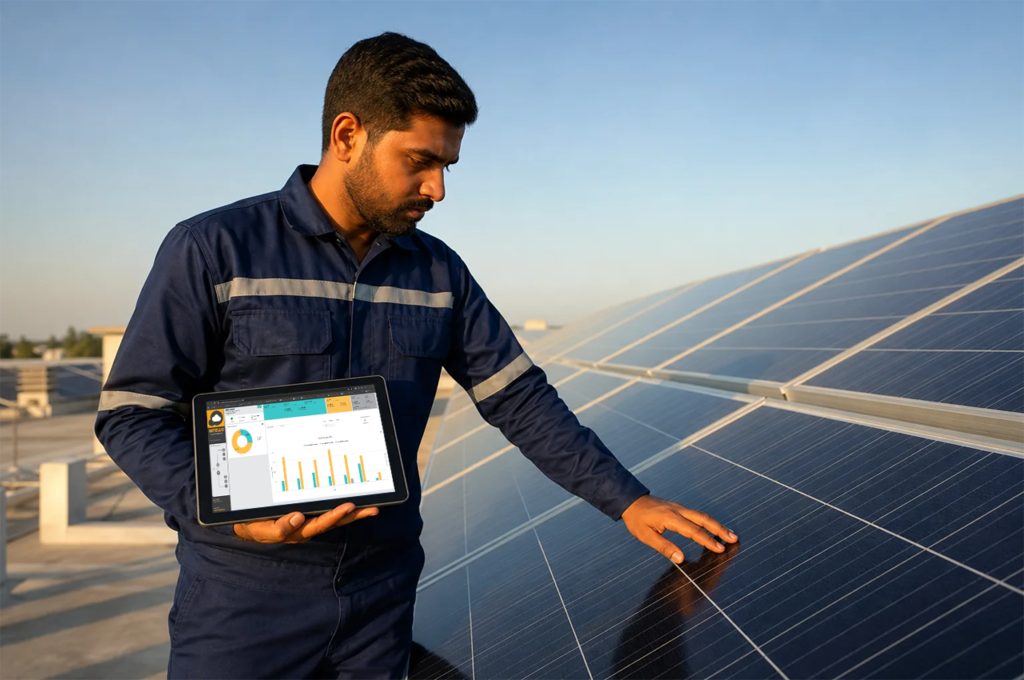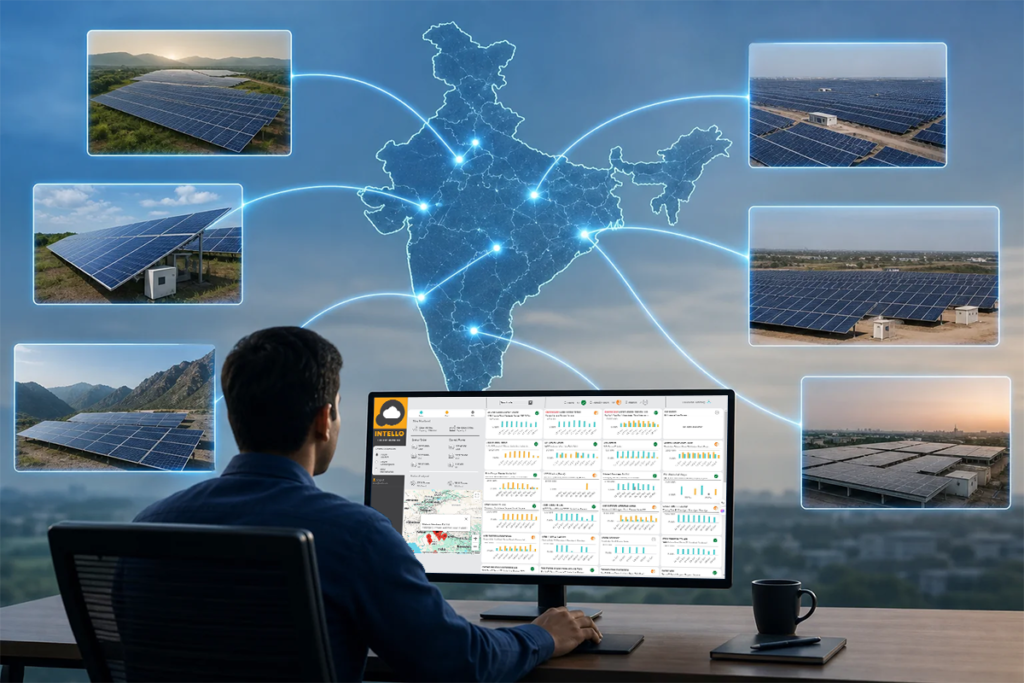
A solar EPC company managing 14 rooftop installations across Gujarat, Maharashtra, and Tamil Nadu once ran its operations on eleven different inverter apps and one shared spreadsheet. Every morning, an engineer logged into each portal separately, copied numbers by hand, and flagged anything that looked off. By the time a string fault in Surat was noticed, it had already cost three weeks of lost generation. That is the reality for most asset owners before they consolidate their operations into centralized solar monitoring for multiple sites in India.
This guide walks through how to actually build that setup: the hardware at each site, the connectivity layer that survives India’s patchy rural networks, the dashboard design, alert configuration, and the reporting workflows that keep asset owners, EPC clients, and O&M teams aligned. Whether you own five rooftop systems or manage fifty across multiple states, the principles below apply the same way.
1. Map Your Portfolio Before You Design Anything
Before choosing any hardware or software, list out exactly what you’re monitoring. This sounds obvious, but it’s the step most asset owners skip, and it’s why so many multi-site rollouts stall halfway through.
Start with a simple inventory. For every site, record:
- Installed capacity (kW or MW) and whether it’s rooftop, ground-mounted, or floating
- Inverter brand and model, since different manufacturers expose data differently
- Grid connection type — net metering, gross metering, or zero-export
- Existing monitoring hardware, if any, and whether it’s an RTU or a basic datalogger
- Network conditions at the site, particularly cellular signal strength in rural or semi-rural locations
- Ownership structure — whether the site belongs to you directly, a client under an EPC contract, or a third-party lessee
This portfolio map becomes the blueprint for your architecture decisions. A commercial rooftop portfolio spread across Pune and Nashik has very different connectivity needs than a set of ground-mounted plants in rural Rajasthan. Skipping this step is the single biggest reason multi-site monitoring projects run over budget or under-deliver on visibility.
2. Understand the Architecture Behind Centralized Multi-Site Monitoring
Once your portfolio is mapped, the architecture itself has three layers: data capture at the site, transmission to a central server, and aggregation into one dashboard.
At the site level, an IoT-enabled Remote Terminal Unit (RTU) pulls data directly from inverters, energy meters, and, where installed, weather stations. Unlike a basic datalogger that only reports generation figures on a fixed schedule, a properly configured RTU can capture string-level current and voltage, inverter fault codes, and grid parameters in near real time. For a portfolio spanning multiple sites, this granularity matters. It’s the difference between knowing “Site 4 generated less energy today” and knowing “String 3 on Inverter 2 at Site 4 tripped at 11:40 AM due to a ground fault.”
From the RTU, data travels over an M2M (machine-to-machine) SIM connection to a central server. This is the layer most asset owners underestimate. If you want a deeper technical breakdown of how this connectivity actually works, our earlier piece on zero-export solar setups in India touches on how grid-side data reporting interacts with connectivity requirements, particularly for sites under export restrictions.
The final layer is the centralized dashboard itself, where data from every site is normalized into a single login. This is what lets a facilities manager in Bengaluru check generation across sites in Coimbatore, Nagpur, and Jaipur without switching between five different portals. If you’re still deciding between RTU-based and datalogger-based systems for your rollout, our guide on how to choose a solar monitoring system covers that comparison in more depth.
3. Choose Connectivity That Survives Indian Grid and Network Conditions
India’s solar portfolios rarely sit in ideal network zones. Rooftop systems in dense urban clusters face signal interference from surrounding buildings. Ground-mounted plants in Rajasthan, Gujarat, or Madhya Pradesh often sit in areas with weak or single-carrier cellular coverage. Add periodic load shedding and voltage fluctuation, and connectivity becomes one of the biggest risks to reliable multi-site monitoring.
A few design choices help here:
- Multi-carrier M2M SIMs that automatically fall back to a second network operator if the primary signal drops, rather than relying on a single consumer-grade SIM
- Local data buffering at the RTU level, so readings taken during a connectivity gap are stored on-site and pushed once the connection resumes, rather than lost entirely
- Battery or capacitor backup for the RTU itself, so a brief power interruption at the site doesn’t blind the monitoring system exactly when a fault might be occurring
These aren’t optional extras for a multi-site portfolio. A single-site owner might tolerate an occasional data gap. An owner managing twenty sites cannot, because gaps compound: if five sites go dark simultaneously during a regional network issue, your entire fleet-level reporting becomes unreliable at the worst possible time. This is exactly why standard consumer SIM cards, common in basic monitoring setups, tend to fail multi-site portfolios at scale.
4. Build a Single Dashboard That Works Across Every Site
The dashboard is where centralized monitoring either proves its value or falls apart. A good multi-site dashboard needs two views working together: a portfolio-level summary and a site-level drill-down.
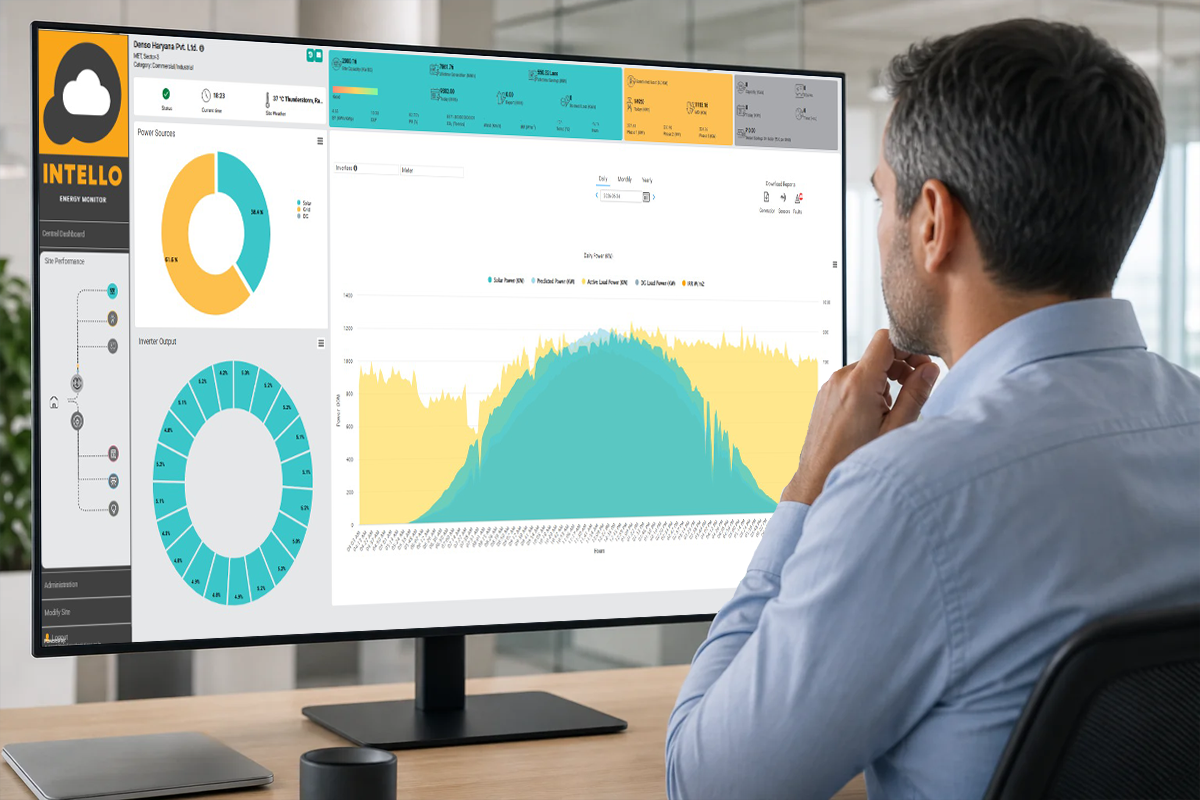
The portfolio view should let you scan every site’s health at a glance, typically with a color-coded status indicator: green for normal operation, yellow for a minor deviation, red for a fault requiring attention. From there, clicking into any single site should reveal the same level of detail you’d expect from a standalone monitoring system, including string-level generation, inverter status, performance ratio (PR), and irradiance data where sensors are installed.
For portfolios that span multiple regions or serve multiple EPC clients, custom groupings matter too. You might want to view sites grouped by:
- Geographic region or climate zone, useful for spotting weather-driven generation dips across a cluster of sites
- Client or asset owner, if you’re an EPC company managing O&M for several separate clients
- Contract type, separating AMC-covered sites from those under a different maintenance arrangement
Standardizing which metrics appear across every site is just as important as the visual layout. If Site A reports performance ratio but Site B doesn’t, portfolio-wide benchmarking becomes impossible. We cover exactly what a well-built dashboard should surface daily in our detailed breakdown, Solar Dashboard: What Should It Show You Daily?, which is worth reviewing before finalizing your metric list.
5. Configure Alerts That Cut Through the Noise
A centralized platform monitoring dozens of sites can generate hundreds of notifications a day if alerts aren’t tuned properly. Left unmanaged, this leads to alert fatigue, where technicians start ignoring notifications altogether because most of them turn out to be non-issues. That defeats the entire purpose of centralized monitoring.
The fix is a tiered alert structure:
- Critical alerts, inverter offline, complete site communication loss, or a fault that indicates safety risk. These should trigger an immediate push notification to the on-call technician, not just an email that sits unread.
- Warning alerts, string-level generation deviation, partial shading patterns, or a gradual PR decline over several days. These need attention but not a same-hour response.
- Informational alerts, scheduled maintenance reminders, AMC visit due dates, or routine firmware updates.
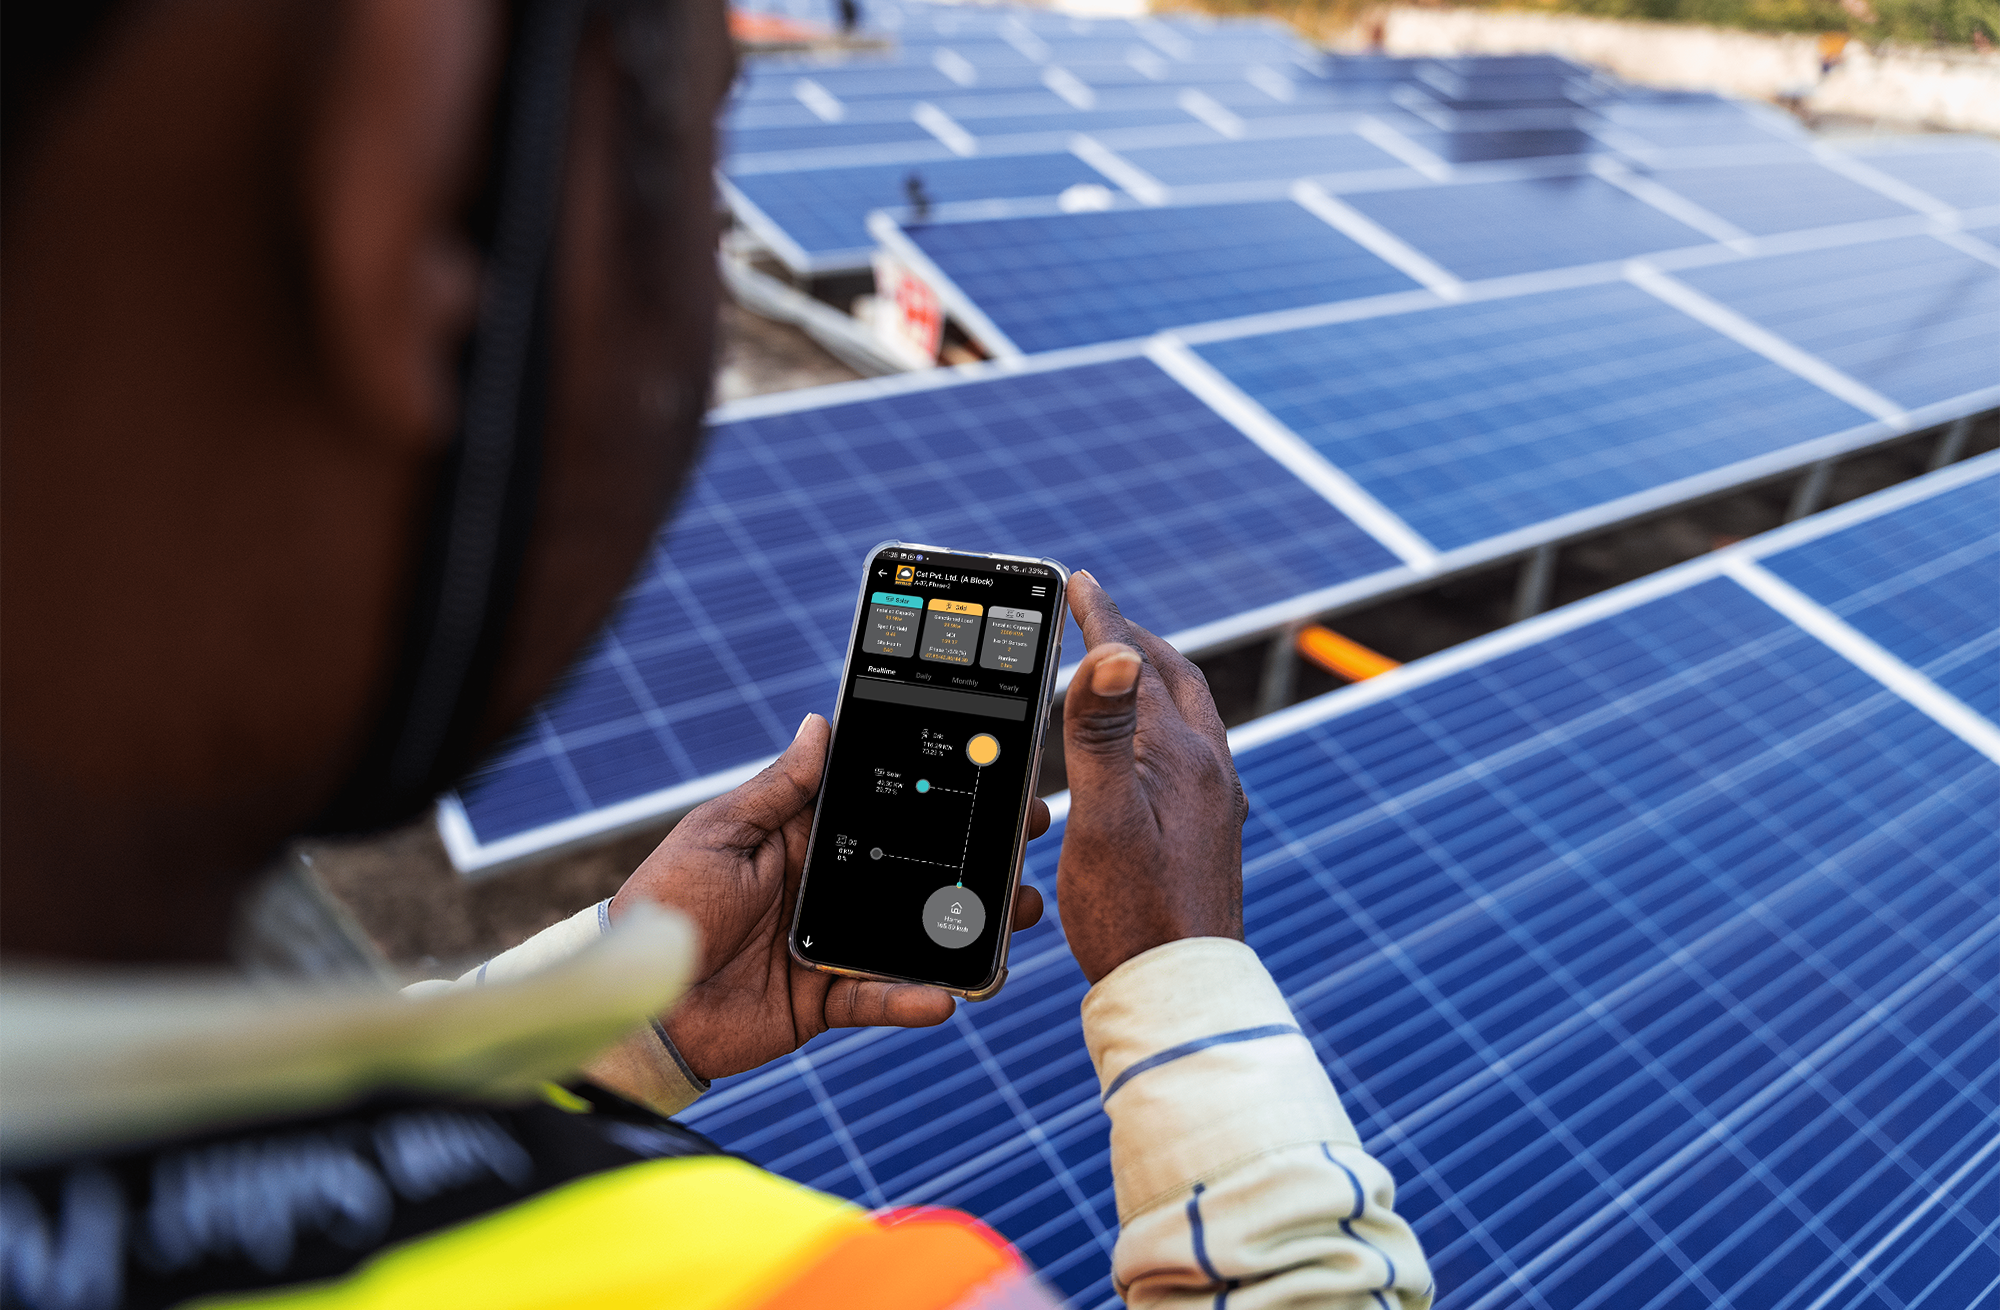
Threshold configuration should also account for site-specific baselines rather than one blanket rule across the portfolio. A 5% generation dip might be normal seasonal variation for a site in coastal Kerala during monsoon, but a red flag for a site in sunny Rajasthan on a clear day. Mobile alerts that include the technician’s location, a timestamp, and a direct link to site data (features built into Intello’s field app, for instance) make it far easier for a dispersed maintenance team to respond quickly, rather than waiting for someone at head office to relay the message.
6. Standardize Reporting Workflows Across Locations
Once monitoring and alerts are running, reporting is what turns raw data into decisions your finance and operations teams can actually use. For a multi-site portfolio, reporting needs to work at three levels: daily operational snapshots, periodic performance reports, and compliance documentation.
Daily and weekly automated reports should summarize generation against expected output for each site, flag any site trending below its historical baseline, and highlight open maintenance tickets. Monthly reports typically roll this up further, comparing site-to-site performance so you can spot chronic underperformers, sites with recurring string faults, or locations where solar degradation is tracking faster than expected.
Field visit reports matter just as much as the digital dashboard. A mobile app that captures location, timestamp, customer signature, and before/after photographs turns every maintenance visit into a verifiable record, which becomes essential when you’re managing AMC compliance or filing a solar warranty claim on behalf of a client. Without this documentation trail, disputes over whether a scheduled cleaning or repair actually happened become far harder to resolve, especially across a portfolio where you can’t personally visit every site.
This reporting layer is also where solar ROI tracking becomes concrete. Instead of estimating losses after the fact, a centralized system lets you calculate actual revenue impact from downtime or underperformance at each site, and compare that against your maintenance spend to judge whether your O&M strategy is actually paying for itself.
7. Common Rollout Mistakes When Scaling Beyond One Site
Multi-site monitoring projects tend to fail for a small set of predictable reasons. Watching for these early saves significant rework later.
- Mixing incompatible hardware across sites. Installing different RTU or datalogger brands at each new site, often chosen by whichever installer built that particular system, creates a fragmented backend that’s difficult to unify into a single dashboard later.
- No standard naming or tagging convention. If Site 1 is labeled “Rooftop-Pune-A” and Site 2 is labeled “Plant2_MH,” your portfolio reports become unreadable the moment you cross fifteen or twenty sites.
- Ignoring string-level granularity at larger sites. Portfolio-level dashboards that only show total generation per site hide exactly the kind of solar string faults that cause the most silent revenue loss.
- Underestimating field coordination. A centralized dashboard tells you something is wrong; it doesn’t fix it. Without a coordinated on-ground maintenance team who can act on alerts across your geographic spread, the monitoring investment delivers visibility without resolution.
Avoiding these mistakes usually comes down to committing to one monitoring standard across the entire portfolio from day one, even if it means retrofitting older sites rather than leaving them on legacy hardware.
8. In-House vs Outsourced: Who Should Run Your Centralized Platform?
Once the architecture is in place, the operational question becomes who watches the dashboard and acts on the alerts. Some larger asset owners build an in-house network operations team dedicated to solar monitoring. Others find it more practical to outsource centralized monitoring and maintenance to a single O&M provider who already runs this infrastructure across multiple clients.
The trade-off usually comes down to scale and core competency. Building an in-house team means hiring, training, and retaining engineers who can interpret string-level fault data, plus maintaining the RTU and connectivity infrastructure yourself. For an EPC company whose core business is building solar plants rather than running a monitoring center, this can pull focus away from what actually grows the business. Outsourcing to a dedicated O&M provider bundles centralized monitoring with the field technicians needed to act on what the dashboard shows, closing the loop between detection and repair rather than leaving that gap for someone else to manage.
We’ve broken down this decision in detail, including cost comparisons and staffing considerations, in In-House vs Outsourced Solar O&M in India 2026, which is worth reading before committing resources either way.
Regardless of which model you choose, the cleaning and physical maintenance side of your portfolio still needs regional planning. Dust accumulation patterns vary sharply across India’s climate zones, and a centralized dashboard that flags a generation dip in a Chennai coastal site needs a different response than the same alert from a site in dusty Jodhpur. Our regional guide to solar cleaning by climate zone covers how to build that schedule alongside your monitoring rollout.
Frequently Asked Questions
How many sites justify investing in centralized solar monitoring?
There’s no fixed number, but most asset owners find the coordination overhead of managing separate portals becomes unmanageable somewhere between three and five sites. EPC companies servicing multiple client installations typically need centralization from the very first few projects, since client reporting alone becomes impractical without it.
Can centralized monitoring work across sites with different inverter brands?
Yes, provided the RTU or monitoring hardware is designed to communicate with multiple inverter protocols. This is one of the reasons custom-designed RTUs, rather than manufacturer-locked dataloggers, tend to suit mixed-brand portfolios better, since they can be configured to pull standardized data regardless of the underlying inverter make.
Does centralized monitoring help with zero-export or DISCOM compliance across a portfolio?
It does. Sites operating under zero-export or net-metering restrictions need continuous visibility into export behavior to stay compliant. A centralized system lets you check compliance status across every site from one dashboard, rather than manually verifying each site’s grid interaction separately.
How long does a typical multi-site monitoring rollout take?
Timelines vary with portfolio size and existing hardware, but a straightforward rollout across five to ten sites with new RTU installations generally takes a few weeks from hardware deployment to dashboard configuration and alert tuning. Portfolios with legacy monitoring equipment that needs replacement take longer, since site visits and hardware swaps add to the schedule.
What happens if a site loses connectivity for an extended period?
A well-designed RTU buffers data locally during an outage and pushes it once connectivity resumes, so you don’t lose historical records. However, extended outages still mean a real-time visibility gap, which is why multi-carrier M2M SIM fallback and battery backup at the RTU level matter for sites in weaker network zones.
Centralized monitoring only delivers value when detection connects directly to action. A dashboard that flags a fault across ten sites is only as useful as the maintenance team that responds to it.
Consolidating monitoring across multiple solar sites in India isn’t just a software upgrade. It changes how quickly you catch a failing string, how confidently you report performance to clients or investors, and how much of your solar investment’s ROI you actually capture rather than lose to undetected downtime. Intello has spent over five years building exactly this kind of integrated platform, backed by 150+ solar experts who turn dashboard alerts into completed repairs on the ground across Indian sites. If you’re managing solar assets across multiple locations and want a single view of performance, faults, and maintenance status, request a quote to discuss a centralized monitoring setup built for your portfolio. Existing customers can check live site data anytime through the Portal Login, and if you’d like to understand more about how Intello’s monitoring and maintenance teams work together, you can learn more about our approach or contact us directly to plan your rollout.