
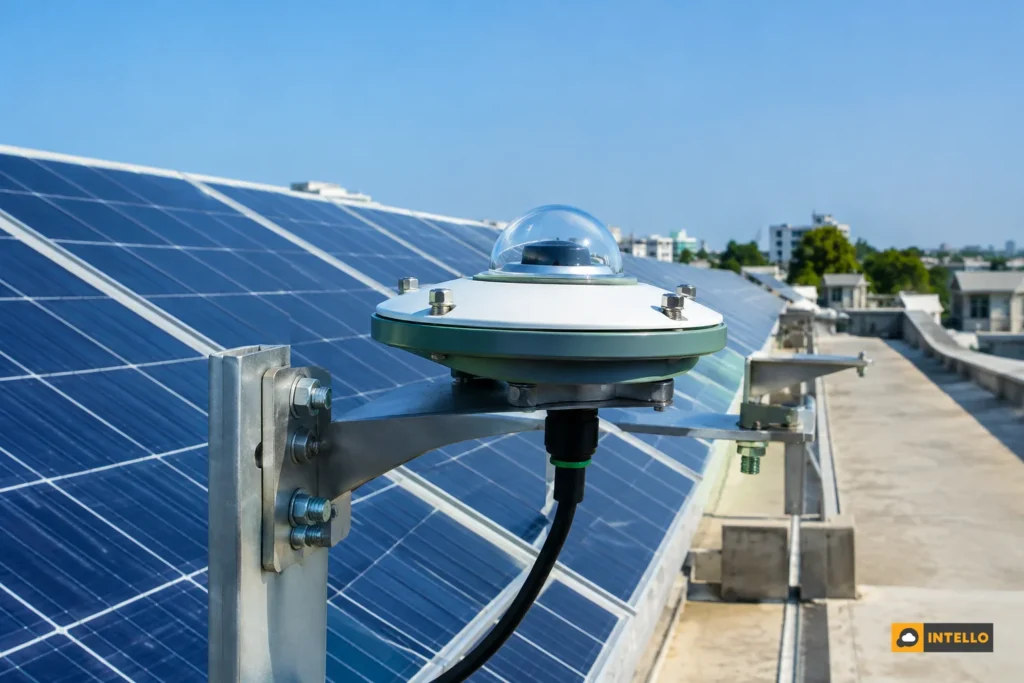
A pyranometer is a sensor that measures solar irradiance, the power of sunlight reaching a surface, in watts per square metre. For solar plants in India, it gives you the one number that separates a weather-driven dip in generation from a real fault. Without that reading, performance ratio and CUF are guesses.
Key takeaways
- Irradiance is the benchmark: a pyranometer tells you how much sunlight the array actually received, so you can judge output against it rather than against yesterday.
- PR needs it, CUF does not: performance ratio divides energy by irradiance-based expectation; CUF only uses capacity and hours, so it moves with the weather.
- Mount in the panel plane: a sensor tilted like the modules (plane of array) gives the number that matters for PR; a flat sensor can mislead.
- Keep it clean and calibrated: a dusty dome or bird dropping reads low and makes a healthy plant look weak.
- Pyranometer or reference cell: both work; choose based on what your contract and reporting standard specify.
Pyranometer quick facts
| Question | Short answer |
|---|---|
| What it measures | Solar irradiance in W/m² over a hemispherical field of view |
| Which reading matters for PR | Plane-of-array (POA) irradiance, with the sensor tilted like the modules |
| Main alternative | PV reference cell (silicon sensor matched to the module technology) |
| Where to mount | On the array plane, unshaded, level to the module tilt, away from reflective surfaces |
| Cleaning rhythm | Inspect the dome on every cleaning round; wipe with a soft cloth |
| Typical failure signs | Flat or low readings in full sun, moisture inside the dome, drift against a neighbouring sensor |
| What it feeds | Performance ratio, expected-generation models, underperformance alerts |
What Is a Pyranometer and What Does It Measure?
A pyranometer is an instrument that measures solar irradiance, the solar power falling on a flat surface, expressed in watts per square metre (W/m²). It looks at the whole sky above it, so it captures direct sunlight and the diffuse light scattered by clouds and haze.
Think of it as the fuel gauge for your plant. Your inverter tells you how much electricity came out. The pyranometer tells you how much sunlight went in. Only with both numbers can you say whether the plant converted that sunlight well.
GHI versus plane-of-array irradiance
Two readings come up often. Global horizontal irradiance (GHI) is measured on a flat, level surface. Plane-of-array (POA) irradiance is measured on a surface tilted like your modules. POA is what the panels actually receive, so it is the right input for judging plant performance.
On a fixed-tilt rooftop in Pune or a ground-mount in Rajasthan, POA and GHI differ every day, and the gap changes through the year. Using GHI to judge a tilted array adds an error you cannot see in the data.
How the sensor works
Most pyranometers are thermopile devices. Sunlight warms a blackened surface under a glass dome, and a thermopile turns the temperature difference into a small voltage. The logger converts that voltage to W/m² using the calibration factor on the sensor’s certificate.
The PV industry has historically relied on thermopile pyranometers for irradiance measurements, as a conference paper hosted on OSTI notes. That long record is one reason they remain common at utility and commercial sites.
Why Does Irradiance Data Matter for a Solar Plant?
Irradiance data matters because generation alone cannot tell you why output changed. A 25% drop in kWh could be a cloudy week or a failed string. A pyranometer shows how much sunlight arrived, so you can compare actual output with what that sunlight should have produced.
Most owners start from the generation graph. When the line sags, the first question is “what broke?” The better first question is “how much sun did we get?” If irradiance fell by the same proportion as output, the plant is fine. If irradiance held and output fell, you have a fault to find.
The blind spot of generation-only monitoring
Without an on-site sensor, teams fall back on satellite estimates, nearby weather stations or last year’s numbers. Each has a gap. Satellite data averages over a wide area, so a local cloud bank or a dust event can be missed. Last year’s numbers ignore this year’s monsoon.
The result is a long argument between the asset owner, the EPC and the O&M team about whether a shortfall is “real”. A calibrated sensor on the array ends that argument with data everyone can see. If you are chasing an unexplained dip right now, our guide to why solar generation drops suddenly lists the faults to rule out once irradiance is known.
Where the data helps most
- Underperformance alerts: flag a plant when output falls short of what current irradiance should deliver, not when it falls short of a fixed number.
- Cleaning decisions: compare PR before and after a cleaning round to see what soiling actually cost.
- Contract disputes: performance guarantees are usually written against irradiance-corrected metrics, so the sensor is evidence.
- Lender and investor reports: PR is the number financiers track, and it rests on the irradiance input.
How Does a Pyranometer Feed Performance Ratio and CUF?
Performance ratio divides the energy your plant delivered by the energy it would deliver at the irradiance it received, using nameplate capacity. The pyranometer supplies the irradiance in that calculation. CUF divides energy by capacity times hours, so it uses no irradiance at all and moves with the weather.
In standard terms, PR is the ratio of measured output to expected output for a reporting period based on the system nameplate rating, as described in a report on irradiance reference measurements for PV systems. The reference yield in the denominator is the irradiation received divided by the reference irradiance. A pyranometer is what produces that irradiation figure.
A worked example with real arithmetic
The numbers below are a hypothetical 100 kWp plant over a 30-day month, chosen to show the logic. They are not measured data from any site.
| Scenario | POA irradiation (kWh/m²) | Energy (kWh) | PR | CUF (720 h) |
|---|---|---|---|---|
| A: Normal sunny month | 180 | 14,040 | 78% | 19.5% |
| B: Cloudy month, healthy plant | 130 | 10,140 | 78% | 14.1% |
| C: Sunny month, hidden fault | 180 | 12,240 | 68% | 17.0% |
PR is energy divided by (irradiation × capacity), with capacity in kW and irradiation in kWh/m². For scenario A: 14,040 ÷ (180 × 100) = 0.78. For scenario B: 10,140 ÷ (130 × 100) = 0.78. For C: 12,240 ÷ (180 × 100) = 0.68.
Look at what each metric would tell you without the sensor. Scenario B’s energy fell by about 28% from A, and its CUF fell from 19.5% to 14.1%. Both look alarming. Yet the plant performed exactly as well as in A. Scenario C lost only about 13% of energy compared with A, which could pass as normal variation, but its PR fell ten points, which is a clear fault signal.
What a PR drop is telling you
A steady PR with falling energy means weather. A falling PR with steady irradiance means the plant is losing something: soiling, shading, string faults, inverter derating or high-temperature losses. Our post on which KPIs matter most on a multi-site solar dashboard shows where PR sits alongside availability and specific yield.
CUF still has a job
CUF is useful for comparing output against capacity across plants and for revenue planning. Just do not read a monthly CUF dip as a fault without checking irradiance. Use CUF for the energy outcome and PR for plant health.
Pyranometer vs PV Reference Cell: Which Should You Use?
Use whichever your contract or reporting standard names. Both measure irradiance for PV plants, but they respond differently. A thermopile pyranometer reads the full solar spectrum evenly; a silicon reference cell responds to light much as your modules do. Many plants fit one of each.
A two-part analysis from the U.S. national laboratory community, published on OSTI, explains that both device types can measure irradiance but that subtle differences exist between the data they produce. The differences show up in uncertainty, spectral response and behaviour at low sun angles.
| Feature | Thermopile pyranometer | PV reference cell |
|---|---|---|
| Measures | Broadband solar irradiance | Irradiance as seen by a silicon cell |
| Spectral response | Flat across the solar spectrum | Matches silicon modules |
| Response to temperature | Dome and housing design reduce thermal effects | Needs temperature correction or a built-in sensor |
| Best fit | Bankable resource assessment, long data records | Day-to-day PR tracking on silicon plants |
| Typical weak point | Dome soiling, calibration drift | Differs from pyranometer readings in some atmospheric conditions |
Research continues on how far the two disagree. A 2026 multi-climate study of tilted irradiance biases between pyranometers and silicon reference cells found that atmospheric variability drives the sensor discrepancies, which means no single correction suits every site.
A decision rule you can apply
- If your performance guarantee names a sensor type or an IEC-based method, use that sensor and nothing else for the guarantee calculation.
- If you have no contractual requirement and run silicon modules, a POA reference cell or POA pyranometer both work for routine PR tracking. Pick one and use it consistently.
- If the plant is large or financed, fit two sensors in the array plane. Disagreement between them is an early warning that one needs cleaning or recalibration.
One thing is not settled in the field: how much correction is worth applying when the two sensor types differ by a small amount. For most O&M work the consistency of the sensor matters more than which type you chose.
Where Should You Mount a Pyranometer?
Mount the pyranometer in the plane of the array, at the same tilt and azimuth as the modules, in a spot that never falls in shadow. Keep it away from reflective surfaces, keep it level on its own axis, and make sure it can be reached safely for cleaning.
Tilt matters more than most teams expect. A sensor that is off the module plane, even slightly, reports a different irradiance than the panels see, and that error flows straight into PR. Treat the mounting bracket as part of the measurement, not as a convenience.
A mounting checklist
- Match the plane: set tilt and orientation to the modules, using a digital inclinometer rather than eyeballing it.
- Check shading: watch the sensor across the day. Parapets, water tanks, railings, lightning masts and neighbouring rows can all shade it in the early morning or late afternoon.
- Avoid reflections: keep it clear of white roof coatings, glass facades and shiny metal that bounce extra light onto the dome.
- Place it representatively: put it near the centre of the array, not at an edge where wind, dust and shading patterns differ.
- Secure the cable: use UV-resistant, sealed cable runs with drip loops so monsoon water does not follow the cable into the connector.
- Record the install: note tilt, azimuth, serial number, calibration date and photo evidence in the handover file.
That last point is often missed. Our solar EPC handover checklist already lists the documents an O&M team needs, and the sensor’s calibration certificate and mounting record belong in that pack.
Indian site realities
Rooftops in dusty belts such as Rajasthan, Gujarat and the Delhi region collect dust on a sensor dome as quickly as on a module. Coastal plants face salt mist. Many rooftops are crowded with structures that cast moving shadows. Walk the roof at three times of day before you fix the bracket.
Ground-mounted plants have another issue: the sensor is often installed at one end of the site, out of sight. A sensor nobody visits is a sensor nobody cleans.
How Do You Maintain a Pyranometer?
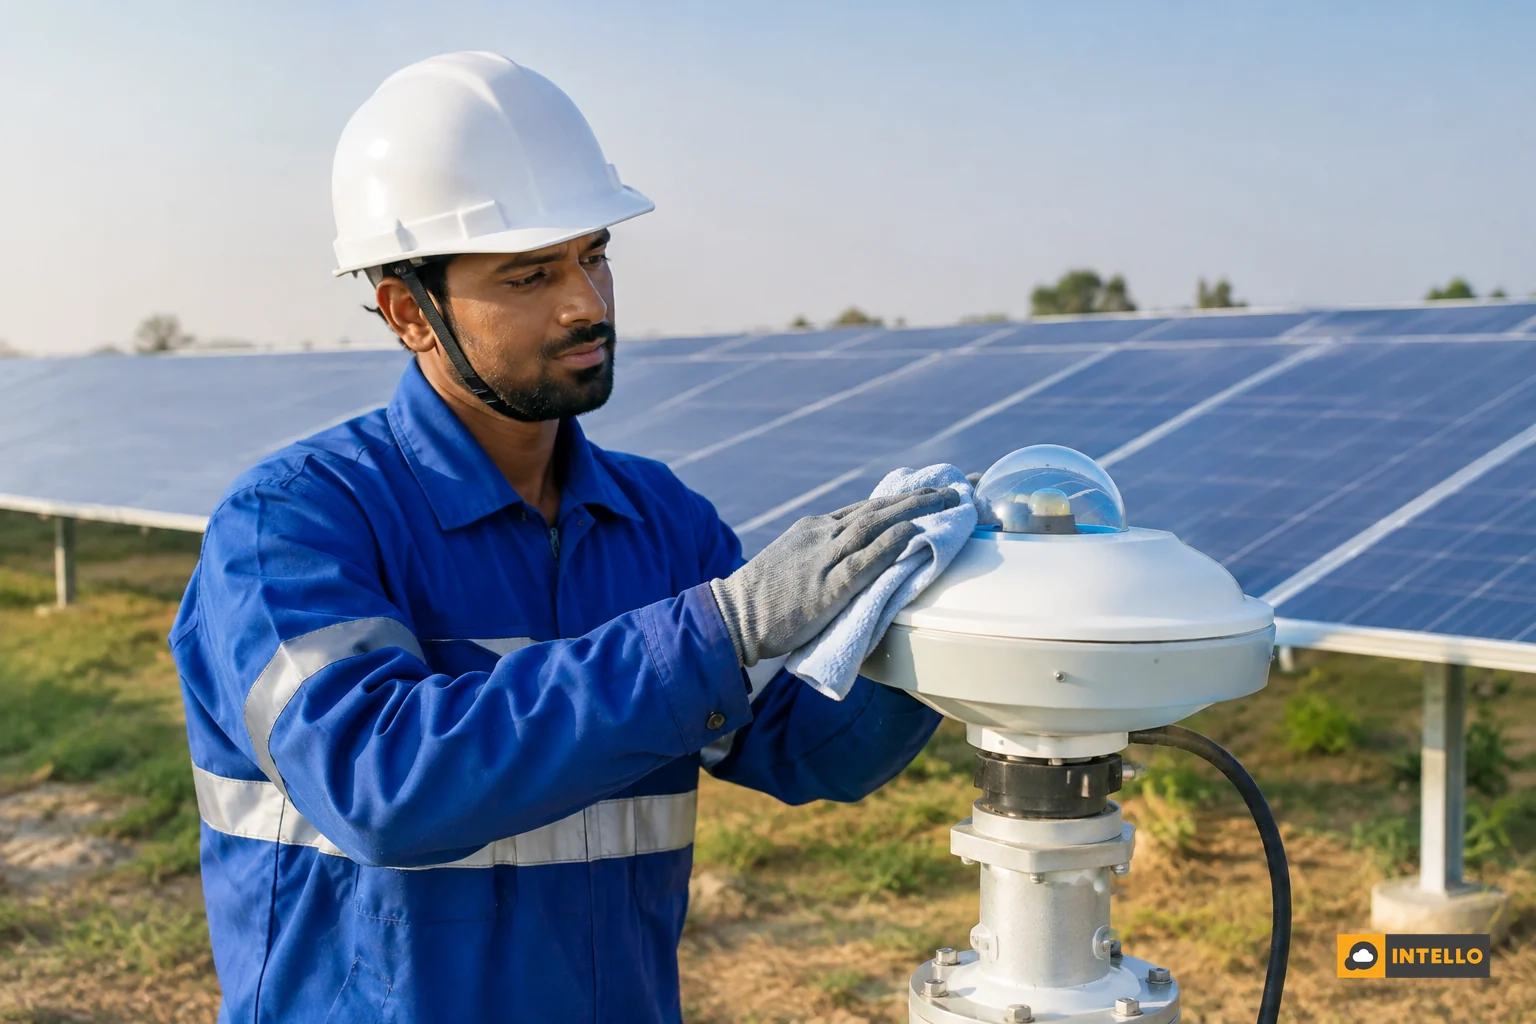
Maintain a pyranometer by cleaning the dome regularly, checking for moisture or cracks, comparing its reading with a second sensor, and recalibrating on the schedule set by the manufacturer’s certificate. A dirty or drifting sensor under-reports sunlight and makes a healthy plant look underperforming.
Routine tasks
- Dome cleaning: wipe with a soft, lint-free cloth and clean water on every panel-cleaning round. Never use abrasive pads; scratches change the response permanently.
- Bird droppings and insects: check after any bird activity. Droppings on the dome block light just as they do on modules, as our guide to bird droppings on solar panels explains.
- Condensation check: look for fogging or water drops inside the dome, and check the desiccant if the model has one.
- Level and alignment: confirm the tilt has not shifted after storms, maintenance work or loose bracket bolts.
- Cable and connector: inspect for cracks, loose glands and corrosion, especially before and after the monsoon.
- Data sanity check: at solar noon on a clear day, confirm that the reading is plausible and that it follows a smooth curve through the day.
Calibration and cross-checks
Every sensor drifts over time. The manufacturer’s certificate states the calibration factor and recommends a recalibration interval, so follow that, and keep the certificate where the O&M team can find it. If you cannot recalibrate quickly, cross-check against a second sensor on the same plane.
A simple routine works well: each month, compare the two sensors across a clear day. If they differ by more than your agreed tolerance, clean both first and then re-compare. Persistent disagreement means one needs service.
Tie it into your monitoring
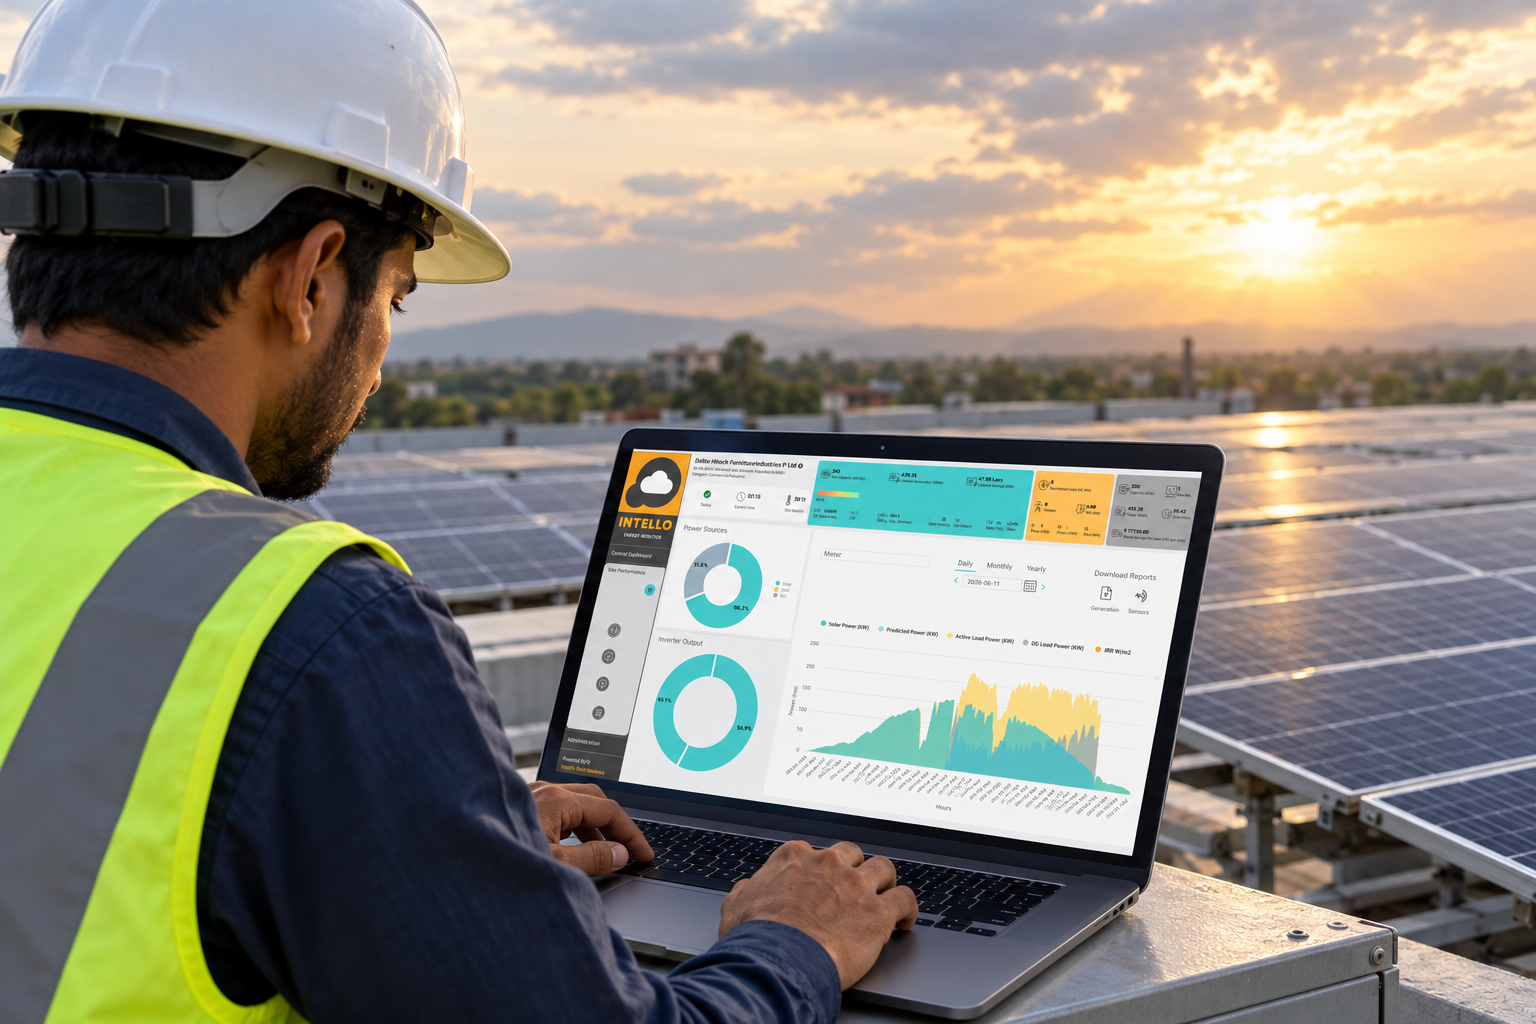
Irradiance only helps if it is logged at the same interval as inverter data and shown beside it. A good dashboard overlays POA irradiance and power on one chart. Our article on what a solar remote monitoring dashboard should show you covers that layout, and the notes on how IoT sensors detect solar faults show how sensor data is used for early detection.
Flag a sensor fault as its own alarm. A pyranometer that reads zero in daylight should trigger a maintenance ticket, not a PR calculation.
Common Pyranometer Mistakes That Distort PR
Most bad PR numbers come from the measurement, not the plant. These errors turn up repeatedly in field audits and are all avoidable.
- Wrong tilt: a horizontal sensor feeding a tilted-array PR calculation.
- Soiled dome: readings drift lower week after week, and PR looks better or worse depending on which sensor is cleaner, the sensor or the panels.
- Shaded position: the sensor loses sun early while the array is still lit, so PR spikes at the edges of the day.
- Mismatched intervals: irradiance logged every minute and energy logged every 15 minutes, then compared without alignment.
- Stale calibration factor: an expired or swapped sensor with the old factor still entered in the logger.
- Single sensor, no check: no second reading to catch drift.
Before you blame the modules for a low PR, rule out the sensor. It is the cheapest thing to check and often the culprit. If soiling is the suspect, learn how Intello approaches plant monitoring and upkeep to see how data and field visits work together.
Pyranometer Cost and Budget Factors
We do not quote sensor prices here, because they vary by model, class, calibration and supplier, and you should get written quotes. What matters for budgeting is the set of factors that move the total.
- Sensor class and accuracy: higher-grade thermopile pyranometers cost more than basic units or reference cells.
- Number of sensors: a second sensor adds cost but buys a built-in cross-check.
- Mounting hardware: brackets, levelling fixtures and cabling add to installation.
- Logger compatibility: the sensor output (voltage, current or digital) must match what your data logger or RTU accepts.
- Recalibration: a recurring cost, and often skipped, which is where the hidden risk sits.
- Maintenance time: cleaning and checks, usually folded into a regular service visit.
For most commercial plants, the sensor is small next to the cost of one hidden fault that runs for months. A plant that loses a few percentage points of PR for a year pays far more than a good sensor and its upkeep.
Frequently Asked Questions About Pyranometers
Is a pyranometer the same as a solar meter?
No. A pyranometer measures sunlight arriving at the site, in W/m². A solar energy meter measures the electricity your plant generates or exports, in kWh. You need both to calculate performance ratio, because PR compares the electrical output with the sunlight that produced it.
Does a small rooftop system need a pyranometer?
Usually not for a home system, where inverter app data and a simple cleaning schedule are enough. A pyranometer pays off on commercial and industrial plants, multi-site portfolios and any plant with a performance guarantee, where you must prove underperformance is not caused by weather.
How accurate does the sensor need to be?
Accurate enough that a small sensor error does not hide a real fault. Your contract or the IEC-based method it cites usually sets the class and tolerance. For routine O&M, a clean, well-aligned, regularly checked sensor is worth more than an expensive one left dirty.
Can I use satellite data instead of a pyranometer?
Satellite-derived irradiance is useful for planning and for sites without sensors, but it is an estimate averaged over an area. On-site measurement catches local cloud, dust and haze, so it is the better basis for judging a specific plant’s daily performance.
Turn Irradiance Data Into Better Plant Decisions
A pyranometer does one job: it tells you how much sunlight your plant was given, so you can judge how well it used it. Mounted in the panel plane, kept clean and checked against a second reading, it turns PR from a rough guess into a trusted number.
Intello runs remote monitoring and on-ground maintenance for solar plants across India, including cleaning rounds, preventive maintenance and fault diagnosis. If your generation numbers keep sparking debate about weather versus faults, request a quote and we will review how your plant’s data is collected and acted on. Existing customers can open their plants through the Intello portal login.
