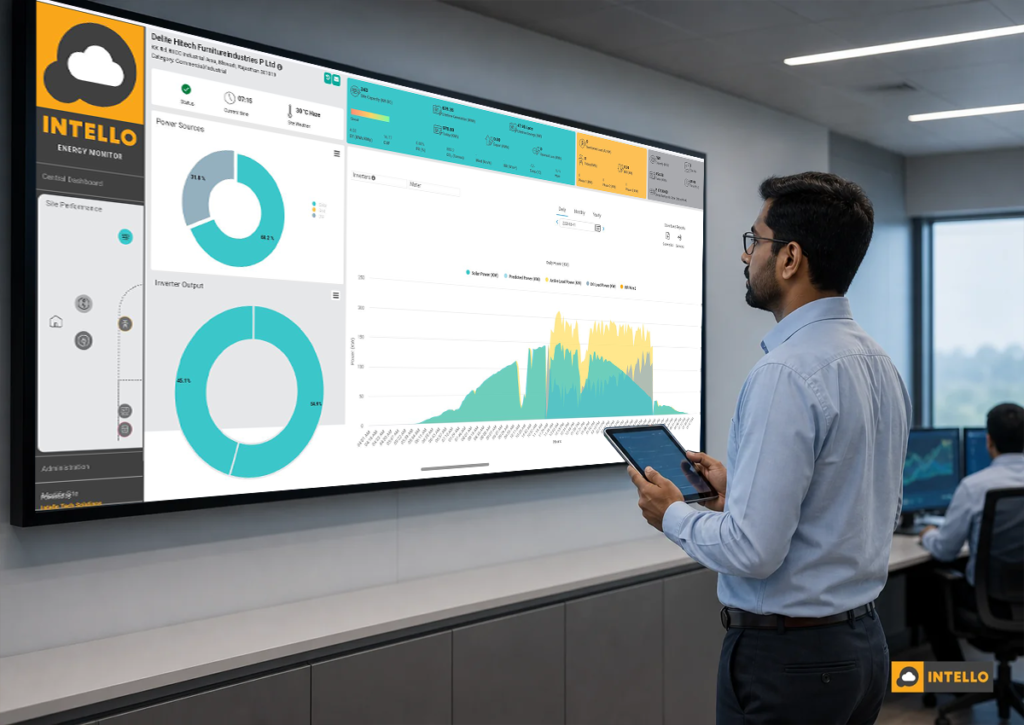
A solar rooftop that is generating power every single day can still leave you staring at a bill that looks almost the same as before installation. That happens because high bills after solar installation are rarely about a system that has stopped working. They are almost always about a system that is working at 60-80% of what it should, quietly, with no alarm going off. The gap between “the inverter is on” and “the plant is producing what it was designed to produce” is where most of the missing savings hide.
Key Takeaways
- Soiling alone can cut output by 10-15% in dry states like Rajasthan and Gujarat within a few weeks of the last clean, with zero fault codes triggered.
- Undersized systems are a billing problem, not a fault: if your load grew after installation (new AC units, EV charging, added floors), the plant was never sized to offset the new bill.
- A single weak string can drag down an entire array’s yield by 15-20% without tripping the inverter or showing on a basic app.
- Net metering and billing errors at the DISCOM end are a real and common cause, separate from anything happening on your roof.
- String-level monitoring is the fastest way to find the actual cause instead of guessing between cleaning, repair, or a billing dispute.
At a Glance: Common Causes of High Bills Post-Solar
| Cause | Typical Output Loss | Detectable Without Monitoring? | Fix |
|---|---|---|---|
| Panel soiling | 5-15% | Only if visibly dirty | Scheduled cleaning |
| Undersized system | Bill offset shortfall, not a plant fault | No, requires load audit | Capacity addition or load management |
| String/DC faults | 10-25% | Rarely | String balancing, connector repair |
| Inverter derating/tripping | Up to 30% during trip windows | Sometimes (app shows trips) | Servicing, firmware update, replacement |
| Net metering/billing error | 0% generation loss, 100% billing impact | No, requires DISCOM check | Meter audit, billing correction |
| No real-time visibility | Compounds all of the above | N/A | Remote monitoring with alerts |
Why a Working Solar System Doesn’t Always Mean a Lower Bill
An inverter screen that shows “generating” tells you almost nothing about whether the plant is hitting its target output. Installed capacity is a design number. Actual generation on any given day depends on irradiance, temperature, panel condition, wiring health, and inverter efficiency, and any one of those can slip without producing a visible warning.
This is why so many asset owners across India, from a home in Pune to a factory rooftop in Ludhiana, end up asking the same question a few months after commissioning: the panels look fine, the inverter light is green, so why hasn’t the bill dropped the way the EPC quote promised? The answer is almost always one of six things, and each leaves a different fingerprint in the data.
1. Panel Soiling Is Quietly Cutting Your Output
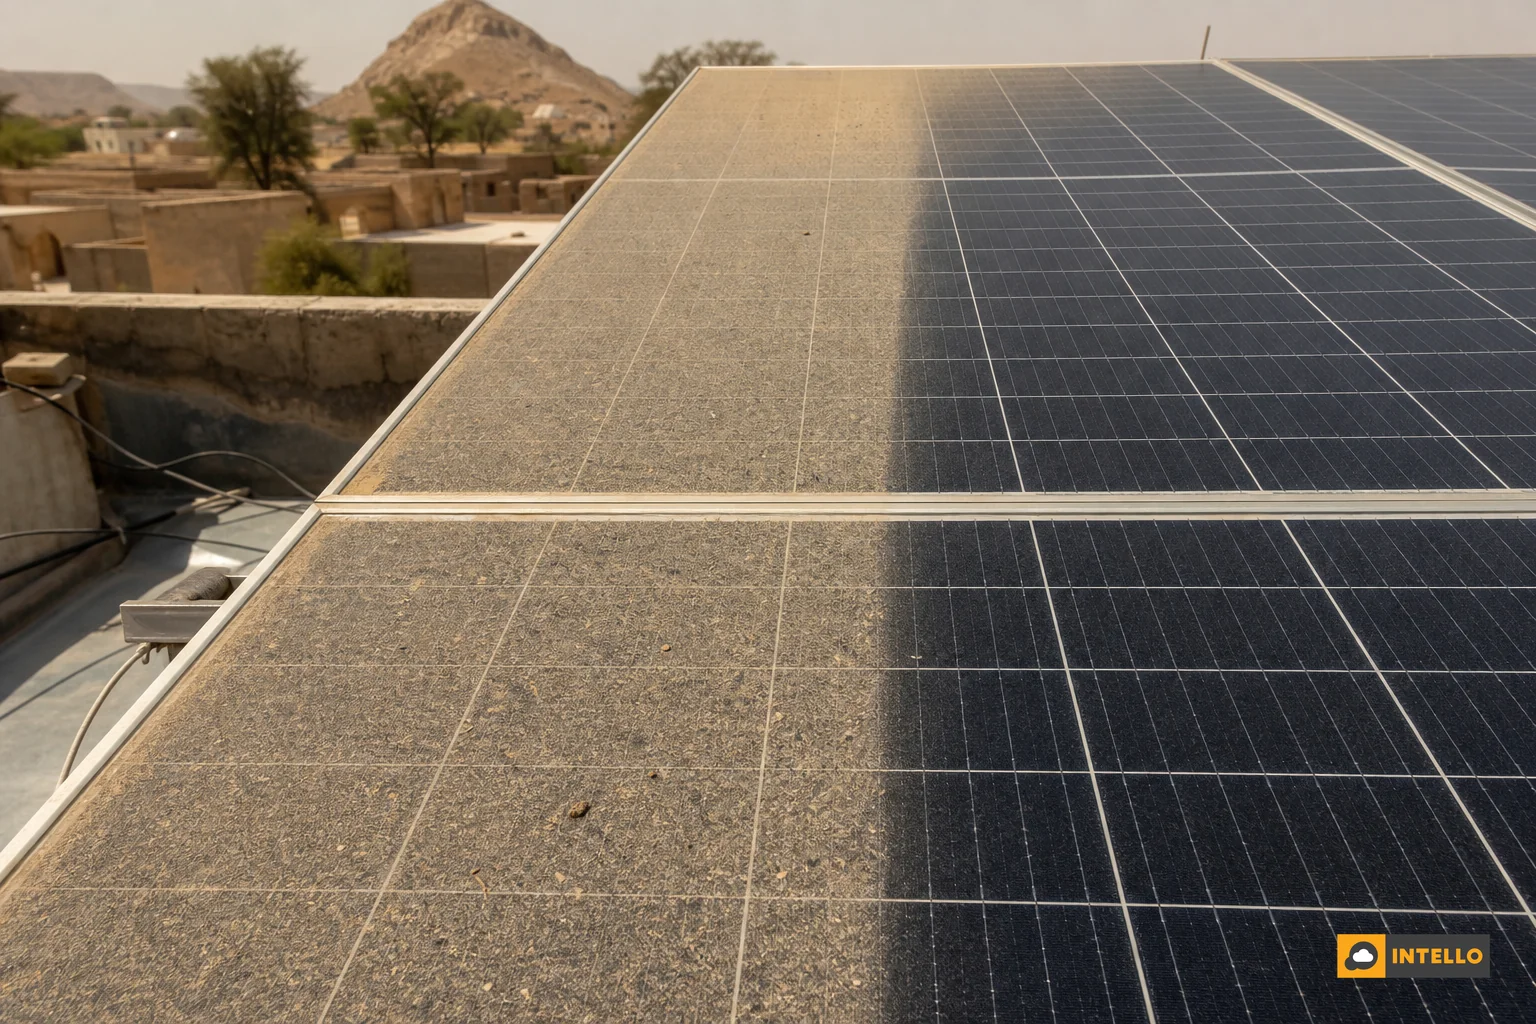
Dust, pollen, bird droppings, and construction grime settle on panel glass every day. In coastal or humid regions the loss builds slowly. In dry belts like Rajasthan, parts of Gujarat, and Madhya Pradesh, soiling loss can climb into double digits within four to six weeks of the last wash, especially during pre-monsoon dust season.
None of this trips a fault code. The inverter keeps running, the app keeps showing “online,” and the owner has no reason to suspect the panels until someone compares actual generation against the plant’s expected baseline. A regional cleaning schedule tuned to your local dust load, not a generic quarterly plan, is the most direct fix. For a state-by-state breakdown of how often panels actually need washing, see our regional guide to solar cleaning by climate zone.
2. Undersized Systems Relative to Actual Consumption
Sometimes the plant is running exactly as designed, and the real issue is that your consumption grew after installation. A new air conditioner, an EV charger, an added floor, or a business expansion all push up the load the system was never sized to offset. The bill looks high because the math behind the original sizing no longer matches how much power you use.
This is a planning gap, not a technical fault. It shows up clearly when you compare the system’s generation against your last three electricity bills side by side, rather than against the bill from the month you installed. Net metering caps set by most DISCOMs also limit how much exported power gets credited, so even a correctly performing plant may not offset a load spike the way owners expect.
3. String Faults and DC-Side Losses
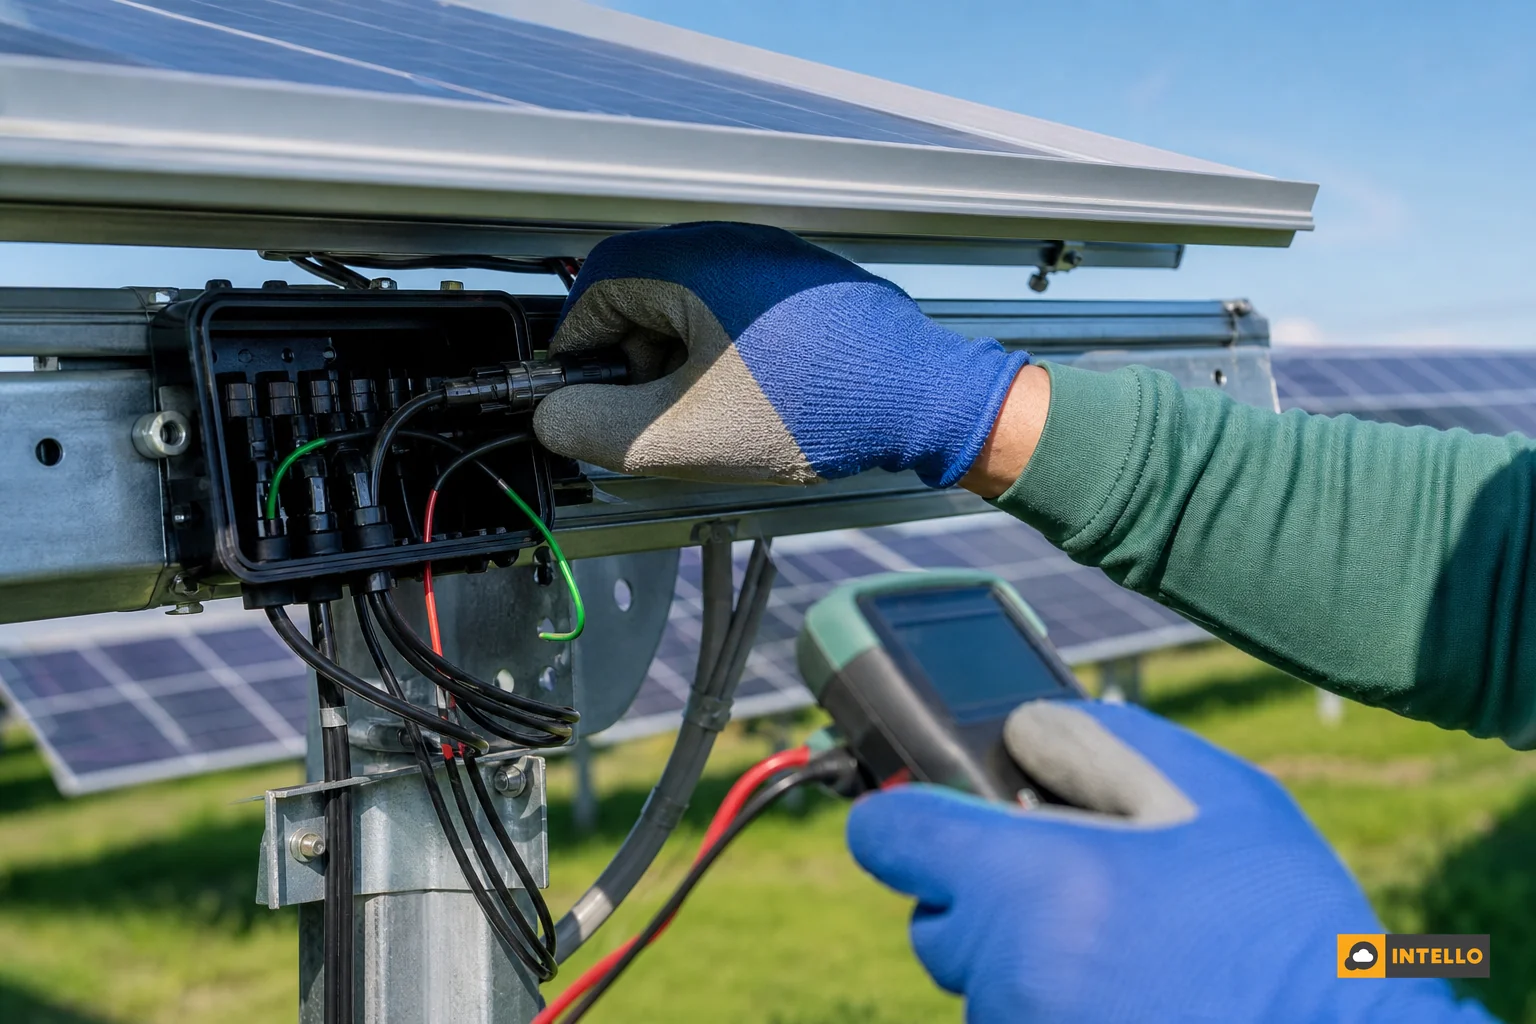
Solar strings are wired in series, and a single underperforming panel or a loose connector in one string can drag down the output of the entire parallel group it belongs to. A weak string caused by a degraded MC4 connector, a partially shaded row, or a cracked cell can silently cost 15-20% of a section’s yield without ever tripping the inverter.
Because DC-side losses hide inside aggregate inverter readings, they are one of the hardest problems to spot without string-level data. Our detailed guide on how IoT sensors detect solar faults before they cost you walks through exactly how sensors catch this kind of mismatch early.
4. Inverter Faults and Inefficient Conversion
Inverters trip, derate, or run below rated efficiency for reasons ranging from overtemperature to grid-side voltage fluctuations, which are common on Indian DISCOM feeders during peak load hours. A unit that trips for twenty minutes every afternoon during the sunniest part of the day loses far more generation than the same downtime would cost on a cloudy morning.
Firmware issues and aging components also cause gradual efficiency loss that owners rarely notice until a monitoring platform flags the drop against baseline. If you are weighing whether a struggling inverter needs servicing or full replacement, our breakdown of inverter replacement vs repair in India covers the warranty traps owners commonly miss.
5. Poor Net Metering Configuration or Billing Errors
Not every high bill traces back to the rooftop at all. A bi-directional meter that isn’t recording exports correctly, a DISCOM billing cycle mismatch, or a net metering application that was never fully processed can all leave an owner paying full retail rates for power their own system generated. This is a paperwork and metering problem, and it requires pulling your DISCOM billing history alongside your generation logs to confirm.
Owners managing solar assets on a rooftop that also runs a diesel generator for backup should also check that zero export setups and DG synchronization are configured correctly, since a misconfigured export limit can silently curtail generation to avoid backfeeding the grid.
6. No Visibility Into Real-Time Performance
Underneath all five causes above sits one common thread: most owners only find out something is wrong when the monthly bill arrives, weeks or months after the loss began. Without a way to compare daily generation against an expected baseline, soiling, string faults, and inverter dips all look the same from the outside: just a bill that’s higher than it should be.
This is the real cost of managing solar by bill alone rather than by data. A performance dip that started in March might not get noticed until the June bill, by which point the plant has already lost three months of output it can never recover.
How Monitoring Pinpoints the Exact Cause
A proper remote monitoring setup tracks generation at the string level, not just the inverter total, and compares it against an expected baseline built from irradiance and historical performance. When actual output drifts from that baseline, the platform can usually tell you within hours whether the drop lines up with a single string (pointing to a wiring or shading issue), the whole array (pointing to soiling or an inverter problem), or the meter data (pointing to a billing issue).
Intello’s monitoring dashboard is built around this kind of diagnosis. Custom RTUs pull data continuously and route alerts to a named technician, who can then confirm the cause on-site with photo and signature evidence logged through a mobile app, rather than everyone guessing from a monthly number. To see exactly what a well-built dashboard should surface every day, read what a solar dashboard should show you daily, and if you’re deciding between hardware options, our RTU vs datalogger comparison explains which fits different plant sizes.
For owners running assets across more than one site, the diagnosis gets harder without a single view. Our practical setup guide on centralized monitoring across multiple sites covers how to consolidate that data into one dashboard instead of chasing separate logins per location.
Rooftop vs Ground-Mounted vs Off-Grid: Where Bills Creep Up Differently
Not all installation types lose output the same way. A rooftop commercial plant, a ground-mounted utility plant, and a residential off-grid or hybrid system each carry a different mix of risk.
| Installation Type | Most Common Cause of High Bills | Watch-Out Point |
|---|---|---|
| Residential rooftop | Soiling and undersizing after new appliances | Net metering caps limit export credit |
| Commercial rooftop | String faults from shading by rooftop equipment | Multiple inverters make manual checks slow |
| Ground-mounted plant | Vegetation shading, cabling damage, larger soiling area | Requires higher-volume cleaning logistics |
| Hybrid with DG backup | DG-PV sync misconfiguration curtailing solar output | Needs correct export limit settings |
Ground-mounted assets in particular carry maintenance issues rooftop teams rarely deal with. Our ground-mounted maintenance checklist lists the specific mistakes site teams make that quietly inflate bills over time.
What To Do If Your Bill Hasn’t Dropped as Expected
Start with a simple three-step check before assuming the worst:
- Pull your last three electricity bills and compare them against your last three months of generation logs from the inverter app, not just the current month.
- Check inverter fault history for trip events, error codes, or repeated derating during peak sun hours.
- Request a monitoring audit from your O&M provider to get string-level readings compared against an expected baseline, rather than relying on the inverter’s aggregate number.
If your system is still under warranty and the EPC handles basic support, start there for hardware-related complaints. But for ongoing performance issues, unexplained bill patterns, or a system that’s more than a year old, a dedicated O&M provider with proper monitoring tools is usually faster at isolating the cause. Homeowners specifically often see measurable gains once a proper AMC is in place; our piece on residential solar AMC benefits after year one covers what changed for owners who made that switch, and if you’re still deciding between contract types, solar AMC vs O&M contract differences is worth a read before signing anything.
According to the Ministry of New and Renewable Energy, rooftop solar capacity across India continues to expand rapidly, which means more owners are running into these exact performance-visibility gaps for the first time. The Central Electricity Authority also publishes grid and DISCOM data that’s useful when checking whether a billing discrepancy is on the meter side rather than the plant side.
Frequently Asked Questions
How long after solar installation should my bill drop?
Most correctly sized rooftop systems show a visible drop within the first billing cycle, typically 30-45 days after commissioning and net meter activation. If your bill hasn’t changed by the second cycle, that’s a strong signal something needs checking, whether it’s soiling, a string fault, or a metering issue.
Can soiling alone explain a consistently high bill?
Yes, especially in dry, dusty regions where soiling loss can reach 10-15% within weeks. But if the bill has stayed high for several months despite regular cleaning, soiling is unlikely to be the only cause, and a monitoring check should rule out string or inverter issues too.
Does an AMC include a performance guarantee?
It depends on the contract. Some AMCs include a guaranteed performance ratio with penalties for underperformance, while others cover only visit frequency and cleaning without output guarantees. Always check the fine print before assuming your bill issue is covered; our guide on what’s included in a solar AMC contract flags the clauses to look for.
If your solar bill still doesn’t match what your EPC promised, the fastest way to find out why is to get actual string-level data instead of guessing between cleaning, repair, and billing disputes. Intello’s monitoring and O&M teams can audit your plant’s performance against its expected baseline and tell you exactly where the loss is happening. Request a quote to get that audit started, or explore your account details anytime through the Portal Login. To see how Intello’s monitoring and maintenance platform works end to end, visit our About page, or simply contact us to talk through your specific bill and generation numbers.