The best solar monitoring app for a commercial portfolio is not the one with the flashiest dashboard. It is the one that catches a string fault at 11 am instead of at month-end billing, sends a real-time alert to the right technician, and logs proof that someone actually fixed it. Everything else is a feature checklist marketing likes to print.
Key Takeaways
- Alerting speed decides ROI: a plant-level daily digest can hide a 12% string loss for weeks; string-level real-time push alerts catch it the same day.
- Multi-site apps must normalise data: comparing raw kWh across sites with different inverter brands is meaningless without specific yield and performance ratio on one screen.
- Photo reporting closes disputes: geotagged, timestamped field photos with customer sign-off protect both the O&M provider and the asset owner during warranty or AMC disagreements.
- Monitoring-only apps stop short: the app should trigger a cleaning schedule or a technician dispatch, not just display a chart.
- Hardware behind the app matters as much as the interface: a custom RTU reading string-level data outperforms an off-the-shelf logger that only pulls inverter totals.
At a Glance: App Features vs Operational Need
Use this table to separate what sounds good in a sales demo from what actually protects your generation numbers.
| Feature | Marketing Claim | Real Operational Need | What to Test Before Buying |
|---|---|---|---|
| Alerting | “Instant notifications” | String-level fault push alerts within minutes, not a daily summary email | Ask for a live demo of an alert firing on a test string |
| Multi-site view | “Manage unlimited sites” | Normalised PR and specific yield across mixed inverter brands | Load two sites with different inverter OEMs and compare |
| Field reporting | “Digital reports” | GPS timestamp, before/after photos, customer signature capture | Check if reports export as shareable PDFs with photo evidence |
| Maintenance link | “Complete O&M solution” | Cleaning schedules and AMC SLAs tied to the same dashboard | Ask if a missed cleaning cycle triggers an escalation |
| Data hardware | “IoT-enabled” | Custom RTU or reliable dongle with M2M SIM, not just WiFi | Ask what happens to data during a connectivity dropout |
| Reporting depth | “Advanced analytics” | Downtime cost in rupees, not just kWh charts | Ask the vendor to show a downtime-to-revenue calculation |
1. Check Whether Alerting Is Real-Time or Just a Daily Digest
Real alerting means a string fault or inverter trip reaches a technician’s phone within minutes, not buried inside an end-of-day summary email. That gap decides whether a 12% output loss gets fixed the same afternoon or discovered a month later on the electricity bill.
Many apps marketed as “monitoring” only refresh totals once every 24 hours. That is fine for a homeowner checking curiosity numbers. It is not fine for a commercial asset owner tracking solar ROI across a plant that loses money every hour a string sits dead.
Ask any vendor to show you what happens at the string level, not just the inverter level. A drop at one string often gets averaged out and hidden inside total plant output, which is exactly how IoT sensors detect solar faults before they cost you real money, when the sensors are placed correctly.
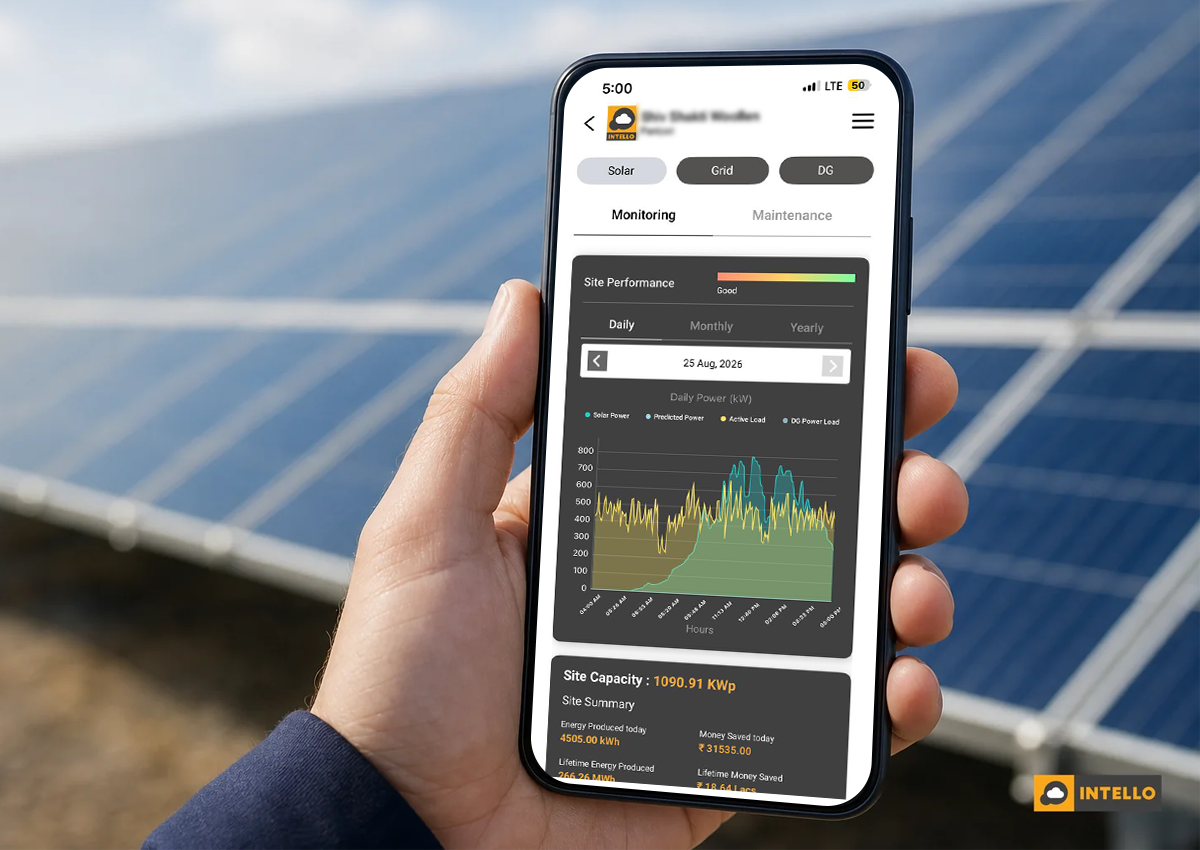
Push-based alerting also matters for solar downtime reduction. Every hour between a fault occurring and a technician being dispatched is generation you cannot recover. The best solar monitoring apps compress that gap from days to minutes.
2. Test the Multi-Site Dashboard With Your Actual Portfolio Mix
A multi-site dashboard is only useful if it normalises data across different inverter brands and capacities on one screen, using specific yield and performance ratio instead of raw kWh. Without that, comparing a 500kW site in Rajasthan to a 200kW site in Pune tells you nothing.
EPCs managing sites for multiple clients face a specific version of this problem. Logging into a dozen separate inverter-brand apps every morning is not monitoring, it is guesswork with extra steps. A genuine centralized platform pulls every site into one login regardless of which OEM’s hardware sits on the roof.
If your team spends more time switching between apps than reading the numbers inside them, the dashboard has already failed its job.
Before signing anything, ask the vendor to load two or three of your actual sites, with your actual inverter brands, and show you the comparison view live. For a deeper breakdown of what belongs on that screen, see this practical setup guide for centralized solar monitoring across multiple sites in India.
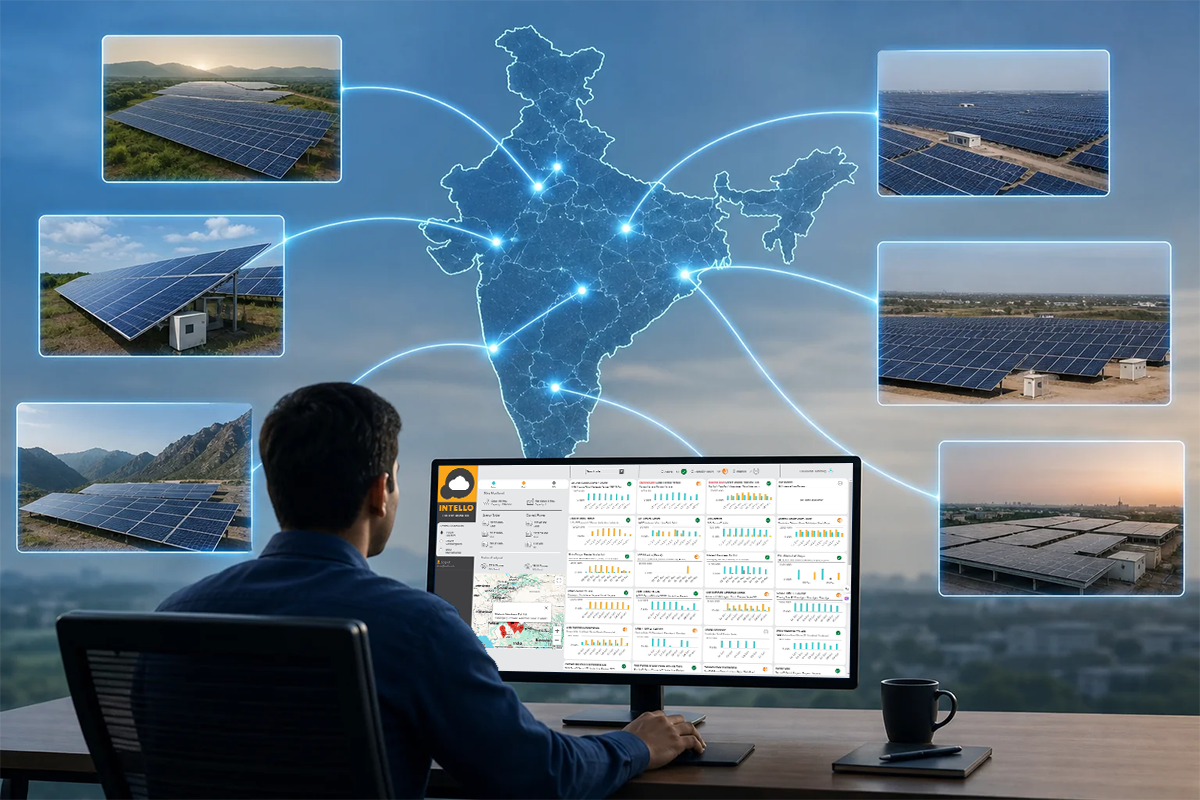
Also check which KPIs the dashboard surfaces by default. A screen crowded with fifteen metrics is as useless as one with only three. The KPIs that matter most on a multi-site dashboard are usually a short list: PR, generation vs target, inverter uptime, and open fault count.
3. Demand Photographic Reporting With Location and Timestamp Data
Photographic reporting means every field visit produces a geotagged, timestamped photo with a customer signature, not just a checkbox saying “cleaning done.” This is the single feature that turns disputes over missed AMC visits into a two-minute lookup instead of a two-week argument.
Commercial asset owners in India often report the same complaint: a maintenance contractor claims a visit happened, but nobody can prove it. Photo reporting with GPS and timestamp data removes that ambiguity entirely.
It also protects the maintenance provider. If a client questions why generation dipped after a supposed cleaning cycle, before-and-after photos with location data settle the question quickly.
This same documentation trail matters during warranty claims on faulty modules or inverters, where manufacturers often ask for dated evidence of the fault. Read the full solar panel warranty claim process in India, step by step, to see exactly what documentation gets requested and when.
4. Verify the App Ties Into Preventive Maintenance, Not Just Viewing
A monitoring-only app shows you a chart. A monitoring-and-maintenance platform uses that chart to trigger action: a cleaning cycle when soiling loss crosses a threshold, a technician dispatch when a string fault fires twice in a week, an AMC renewal reminder before coverage lapses.
This distinction matters more than it sounds. Plenty of apps look identical on the surface, all showing generation curves and fault counts. The difference shows up when a fault actually happens: does the app just log it, or does it push a work order to a technician on payroll?
Ask vendors directly whether their app is connected to an actual maintenance team, or whether it stops at the screen. Intello’s platform ties monitoring data straight into preventive maintenance, string balancing, and solar AMC service schedules, so an alert becomes a dispatched visit rather than a notification nobody acts on. Compare the difference in outcomes in preventive versus breakdown solar maintenance: the real cost.
5. Check Data Transmission Reliability Behind the App
The app is only as reliable as the hardware feeding it data. A custom RTU that reads string-level current and voltage every few minutes gives far more useful data than an off-the-shelf logger that only pulls inverter totals once an hour.
Connectivity is the other weak link. Rural ground-mounted sites in India often have patchy broadband, which is why an M2M SIM-based data connection tends to outperform WiFi dongles for consistency. Ask what the app does when connectivity drops for an hour: does it queue the data and sync later, or does that window just disappear from your records?
If you are still deciding between hardware options, this RTU vs datalogger comparison walks through which setup suits which site type, and the solar monitoring dongle guide covers the simpler, lower-cost option for smaller installations.
How to Check Solar Meter Reading in Mobile
You check a solar meter reading in mobile by logging into your monitoring app or portal, where the reading updates automatically from the RTU or dongle connected to your inverter, without needing to physically read the meter on-site. Most apps refresh this figure every few minutes.
The exact steps are usually: confirm your dongle or RTU is registered against your plant ID, download the provider’s app or open their web portal, log in with your site credentials, and open the generation or “today’s units” tab. Intello customers can check this directly through the Intello portal login.
This differs from a manual meter check in one important way: the app reading reflects data pulled minutes ago, while a physical meter reading only tells you the cumulative total at the moment someone walks up and looks at it. For daily tracking, the app reading is far more useful because it shows trend, not just a single number.
Is the Best Solar Monitoring App Different for EPCs vs Asset Owners?
Yes, EPCs and individual asset owners need different feature priorities from the same category of app, because they are solving different problems. EPCs need multi-client, multi-site views built for scale; asset owners need ROI and downtime cost visibility on a single plant.
An EPC company servicing 50 client sites cares about whether the dashboard can segment by client, generate branded reports for each client, and flag which sites are falling behind SLA. A single commercial asset owner cares more about whether the app translates a fault into rupees lost, so they can justify the cost of fixing it fast.
Residential owners have simpler needs again, usually just daily generation, a cleaning reminder, and an AMC status indicator. For a deeper comparison of contract structures behind these apps, see Solar AMC vs O&M contract in India: key differences.
Cost Factors: What Drives the Price of a Monitoring App in India
The price of a solar monitoring app in India is driven mainly by the hardware behind it, not the software interface itself. A few factors move the number more than any other:
- RTU vs dongle choice: custom RTUs with string-level sensors cost more upfront than a basic dongle but pay back through faster fault detection.
- Number of sites and inverters: per-site or per-inverter pricing scales with portfolio size, so a 20-site EPC portfolio costs more than a single 100kW rooftop.
- Bundled vs standalone: apps bundled inside an AMC or O&M contract often cost less overall than buying monitoring software separately from maintenance.
- Data connectivity plan: an M2M SIM data plan for remote sites carries its own recurring cost, separate from the app subscription.
- Reporting depth: apps with photo reporting, customer sign-off, and downtime-cost analytics typically sit in a higher tier than basic generation-only dashboards.
Rather than comparing sticker prices in isolation, ask for a quote that itemises hardware, data plan, and maintenance linkage separately, so you can see what you are actually paying for. If you want a broader view of O&M pricing structures across the industry, this complete guide to solar O&M in India breaks down services and typical practices in detail.
FAQ
What is a solar monitoring app?
A solar monitoring app is software that connects to hardware on your inverter, such as an RTU or dongle, and shows generation, faults, and performance data on your phone or computer instead of requiring a manual site visit.
Does a monitoring app replace on-site maintenance?
No, a monitoring app cannot clean panels, tighten loose connections, or replace faulty components. It tells you when and where a physical visit is needed; it does not perform the visit itself.
Can one app manage sites in different states in India?
Yes, provided the app supports multi-site dashboards with normalised metrics. Connectivity across states depends more on the SIM or WiFi setup at each site than on the app itself.
What is the biggest sign an app is monitoring-only, not maintenance-linked?
If a fault alert never results in an assigned technician or work order inside the same platform, the app stops at viewing data. A maintenance-linked platform turns that same alert into a dispatched visit with a tracked outcome.
Choosing the best solar monitoring app for your portfolio comes down to testing it against your real sites, not a demo built for a trade show. If your current setup still leaves faults undetected for days or leaves you chasing contractors for proof of a visit, it may be time to switch to a platform built around actual field operations rather than dashboards alone. Request a quote from Intello to see how string-level alerting, multi-site dashboards, and photo-verified maintenance work together on a plant like yours, or learn more about Intello’s O&M track record before you decide.